
Figure 13. Distribution of reference method calculation errors by molecule on our extra set shows that a few of the molecules were more challenging than others.
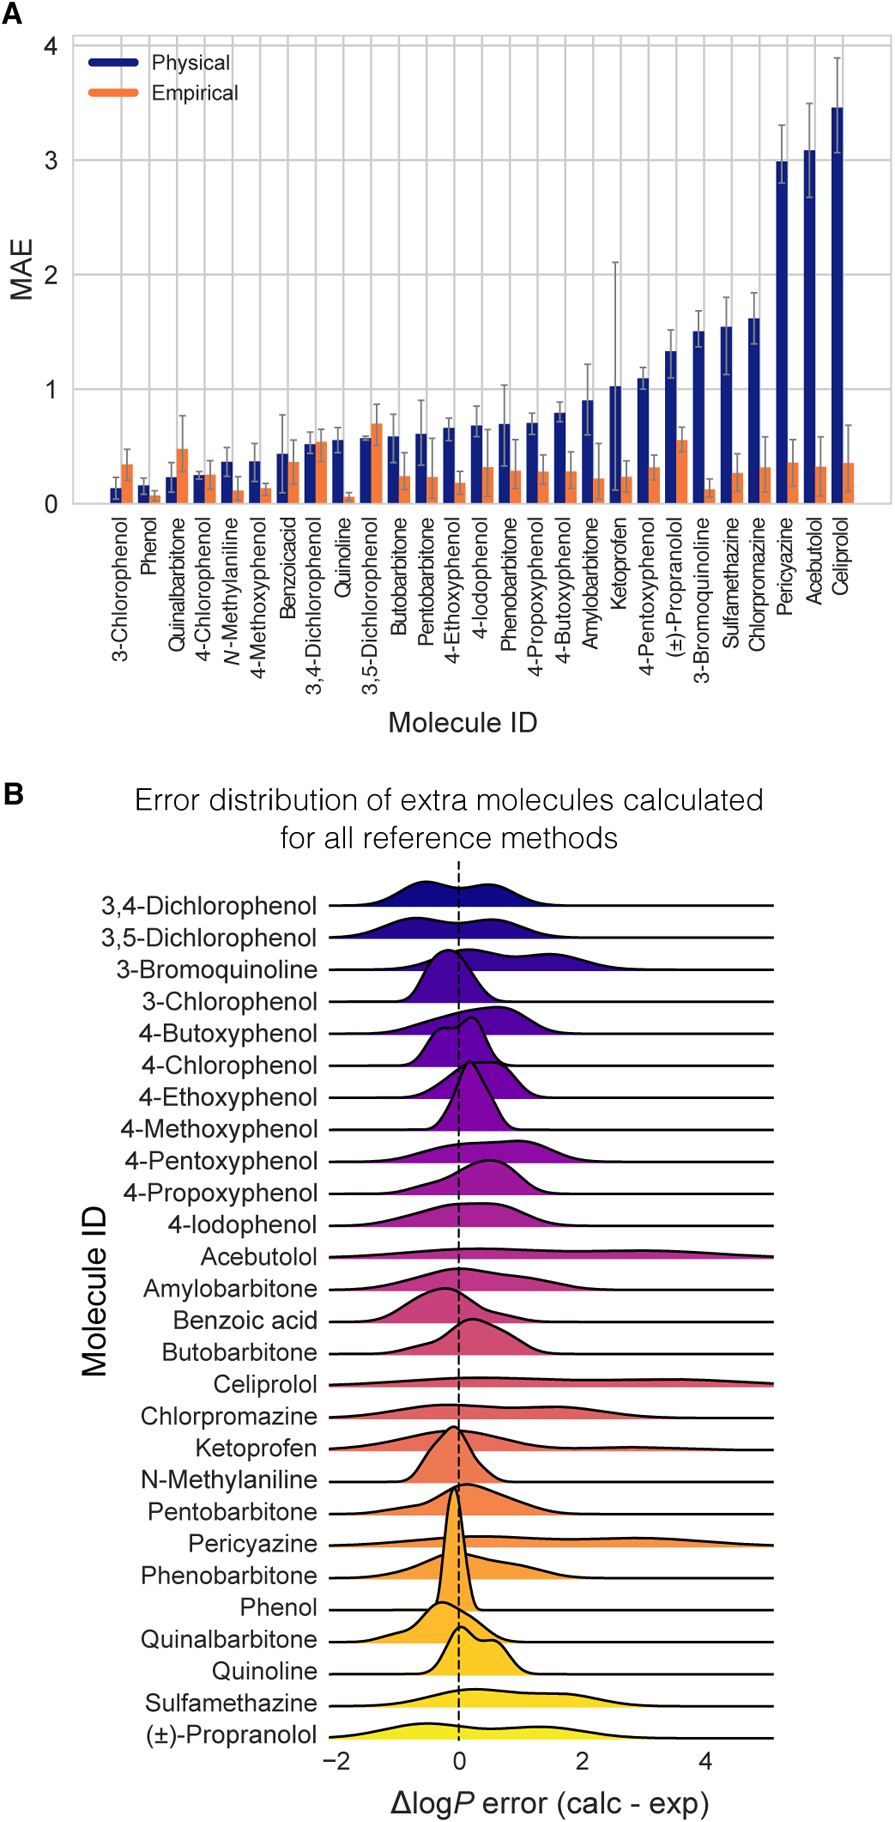
(A) MAE of each of the extra molecules broken out by physical and empirical reference method category. Majority of molecules have mean absolute errors below 1 log P unit for physical reference calculations. All of the mean absolute errors are well below 1 log P unit for empirical reference calculations. (B) Error distribution for each molecule calculated for the reference methods. A couple molecules have a significant tail showing probability of overestimated log P predictions.