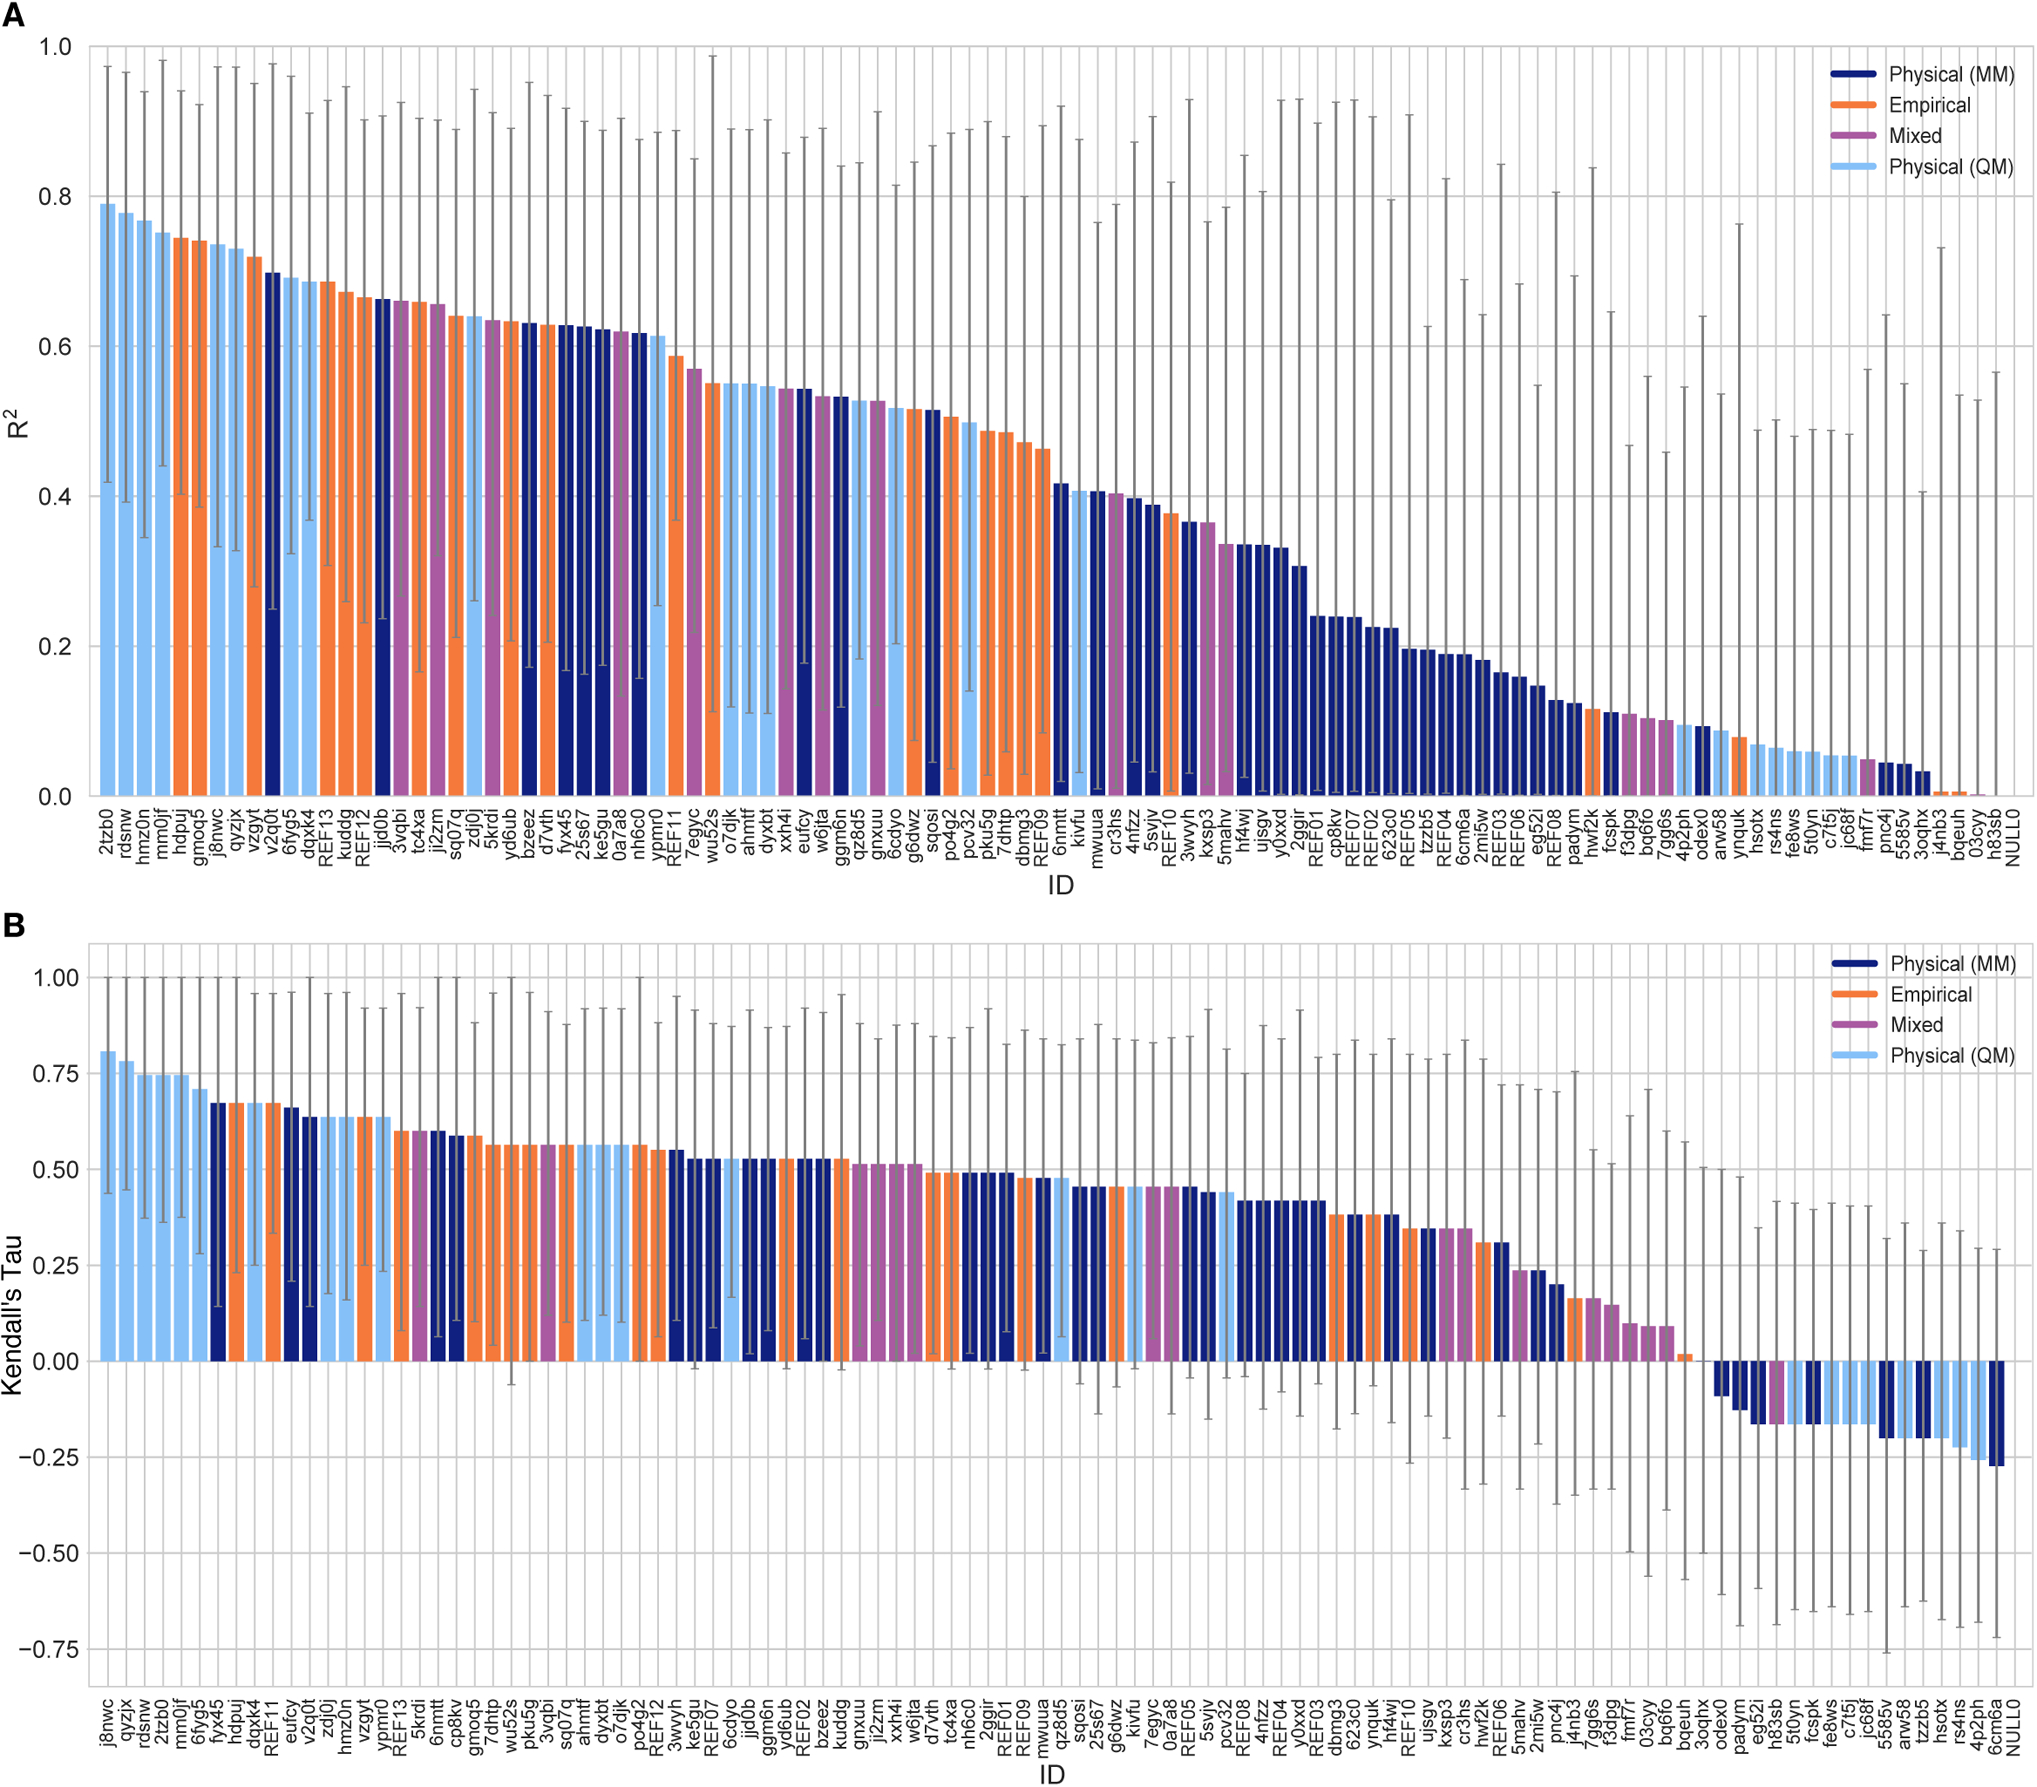
Figure 4. Overall correlation assessment for all methods participating SAMPL6 log P Challenge.

Pearson’s R2 and Kendall’s Rank Correlation Coefficient Tau (τ) are shown, with error bars denoting 95% confidence intervals obtained by bootstrapping over challenge molecules. Submission IDs are summarized in Table 3. Submission IDs of the form REF## refer to non-blinded reference methods computed after the blind challenge submission deadline, and NULL0 is the null prediction method; all others refer to blind, prospective predictions. Overall, a large number and wide variety of methods have a statistically indistinguishable performance on ranking, in part because of the relatively small dynamic range of this set and because of the small size of the set. Roughly the top half of methods with Kendall’s Tau > 0.5 fall into this category.
