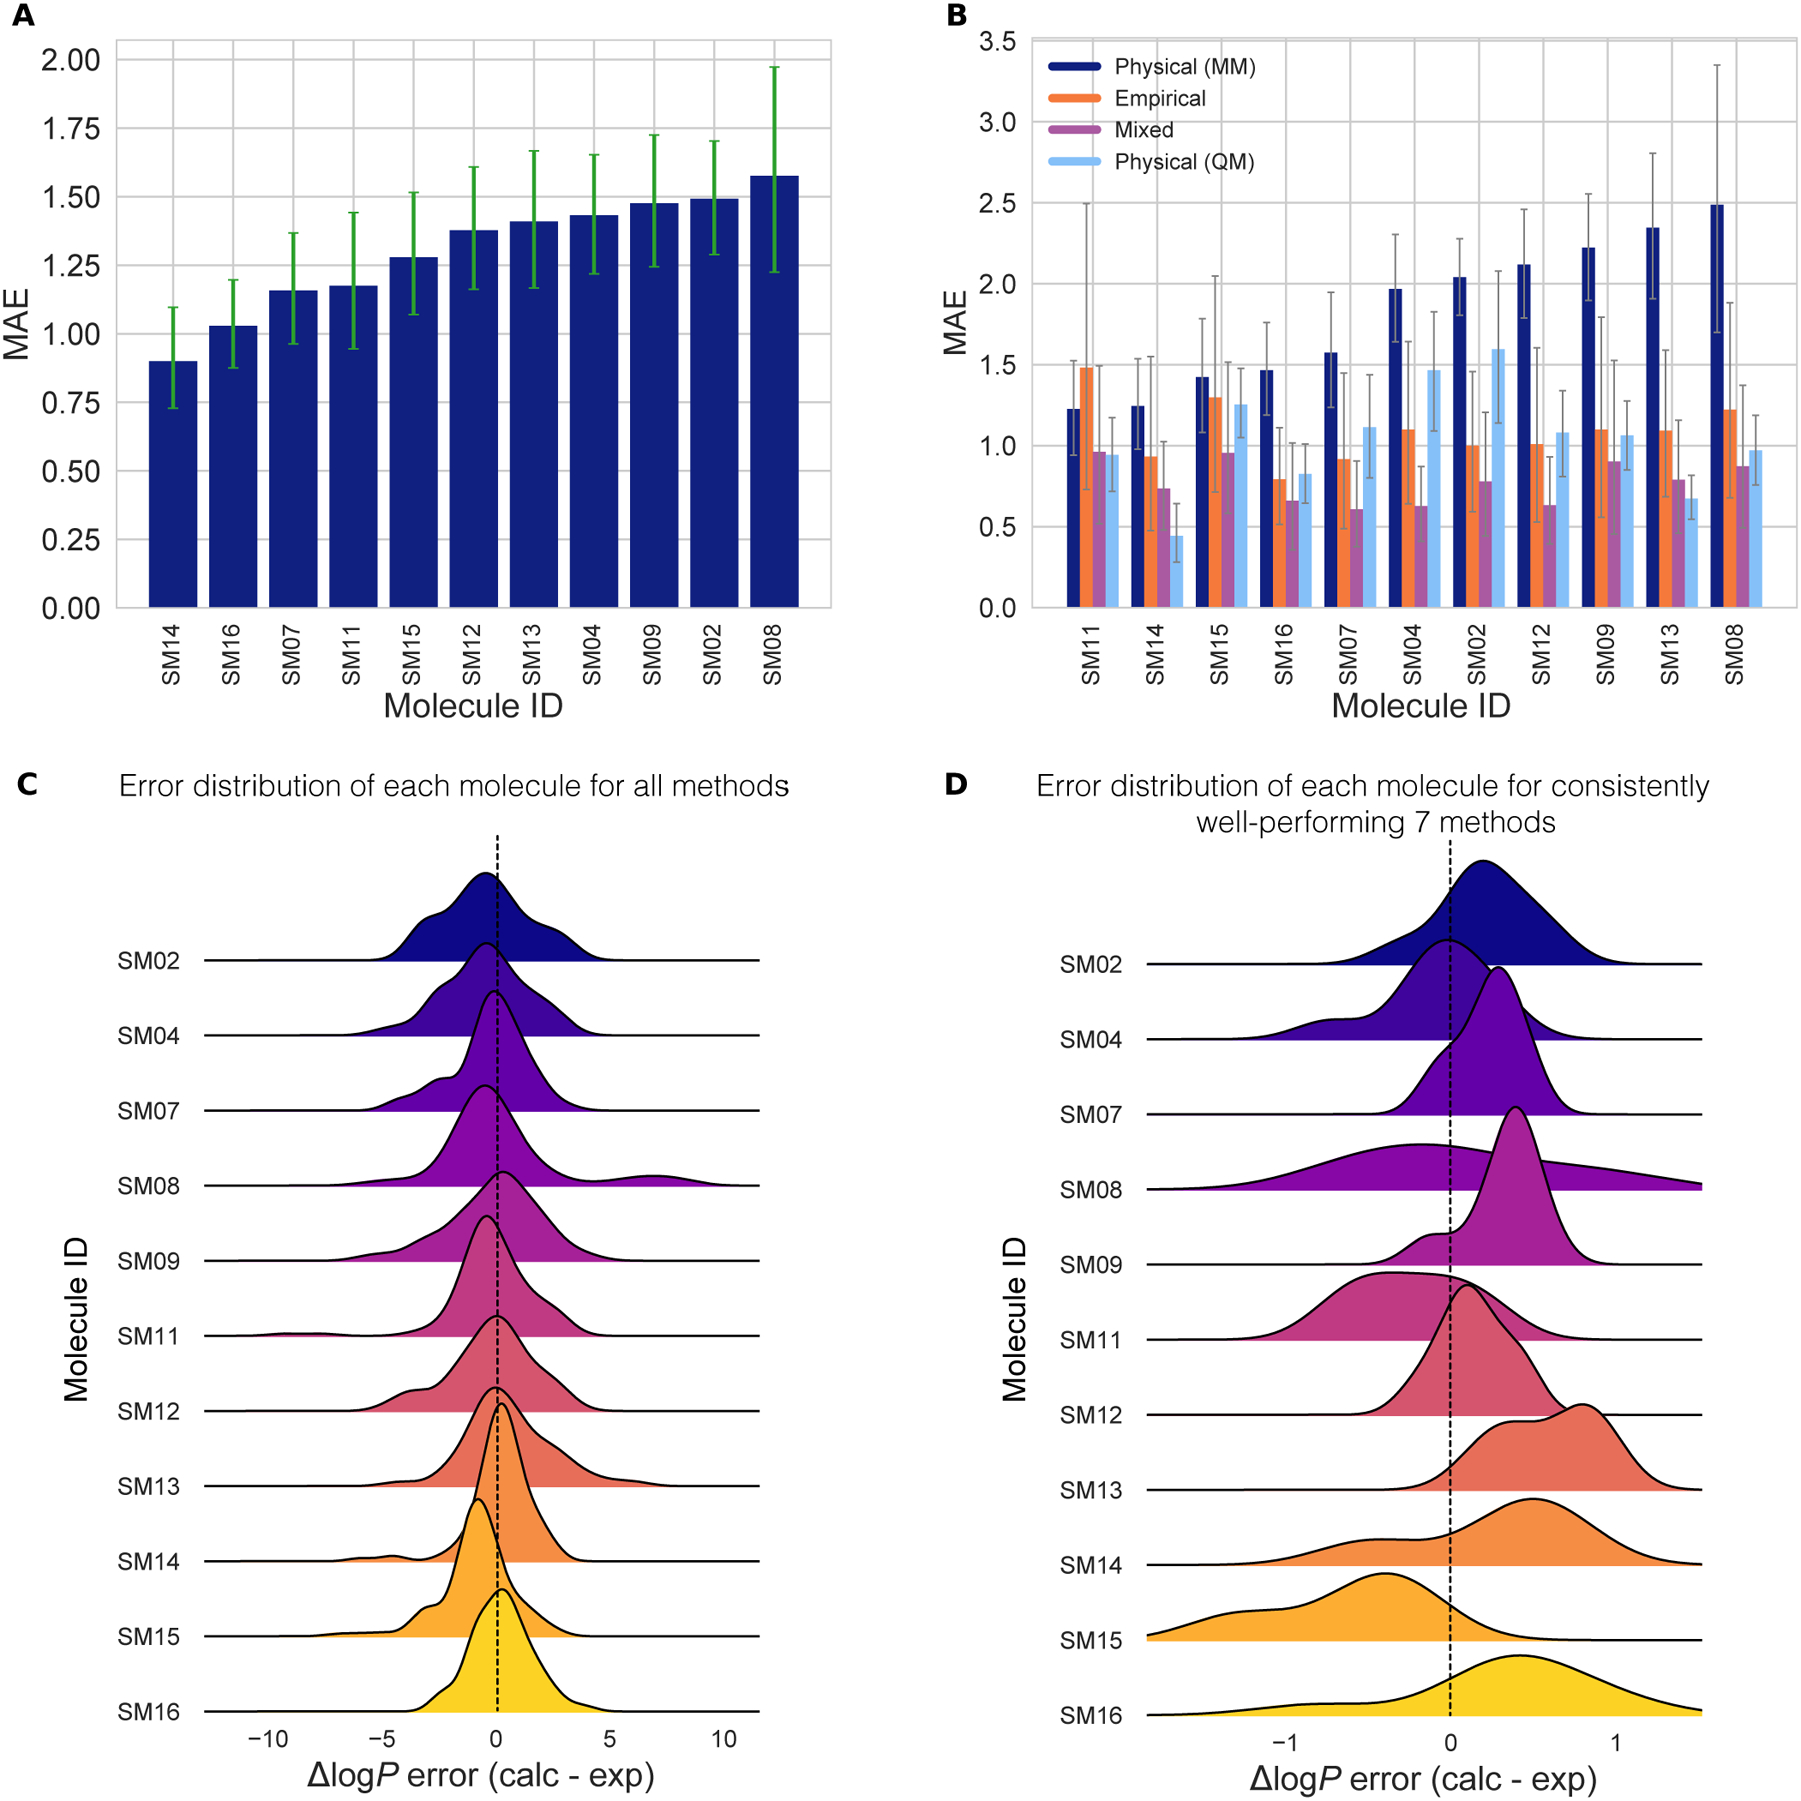
Figure 7. Molecule-wise prediction error distribution plots show how variable the prediction accuracy was for individual molecules across all prediction methods.

(A) MAE calculated for each molecule as an average of all methods shows relatively uniform MAE across the challenge set. SM14 and SM16 predictions were slightly more accurate than the rest. (B) MAE of each molecule broken out by method category shows that for each method category the most challenging molecules were different. Predictions of SM08, SM13, SM09, and SM12 log P values were significantly less accurate with Physical (MM) methods than the other method categories. For QM-based methods SM04 and SM02 were most challenging. Largest MAE for Empirical methods were observed for SM11 and SM15. (C) Error distribution for each SAMPL6 molecule overall prediction methods. It is interesting to note that most distributions are peaked near an error of zero, suggesting that perhaps a consensus model might outperform most individual models. However, SM15 is more significantly shifted away from zero than any other compound. SM08 has a significant tail showing probability of overestimated log P predictions by some methods. (D) Error distribution for each molecule calculated for only 7 methods from blind submissions that were determined to be consistently well-performing (hmz0n, gmoq5, j8nwc, hdpuj, dqxk4, vzgyt, qyzjx).
