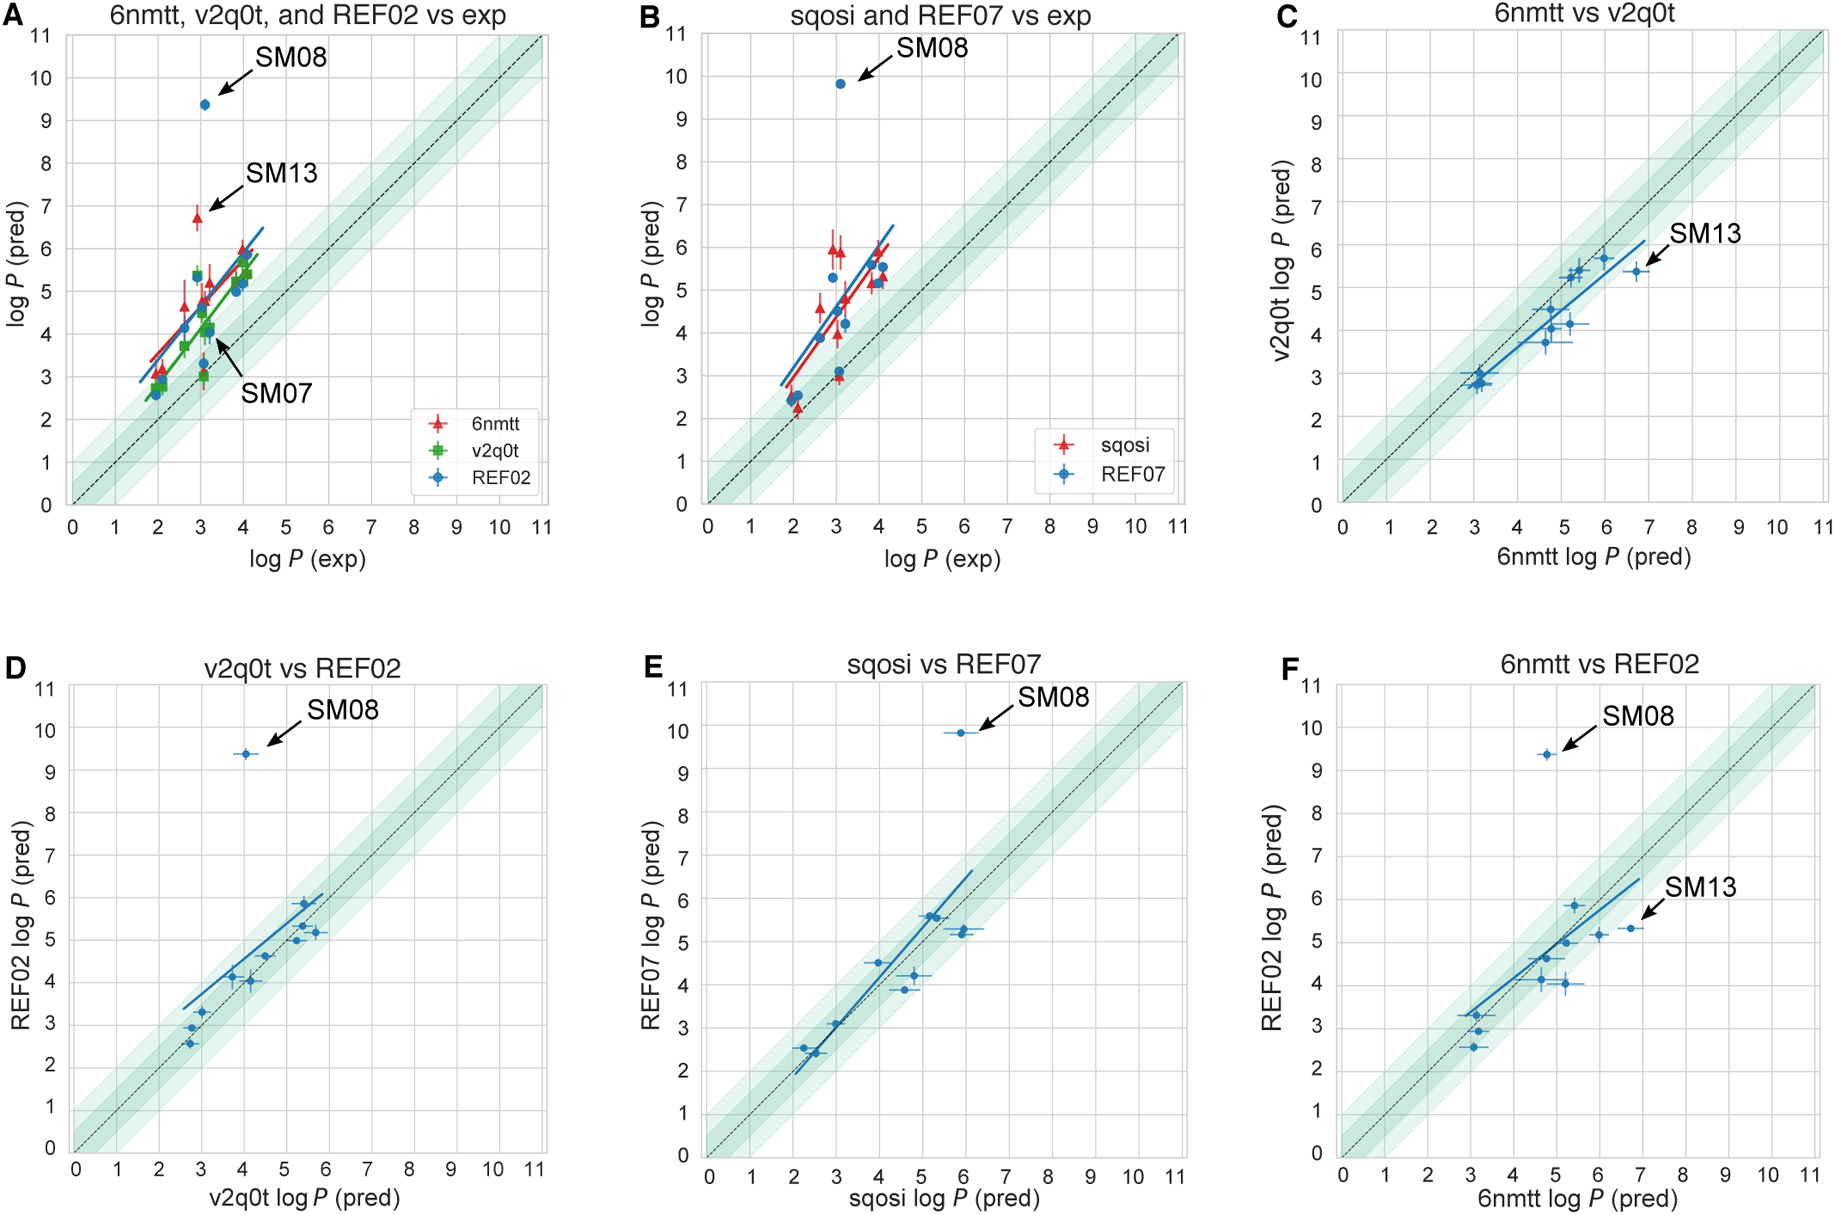
Figure 8. Comparison of independent predictions that use seemingly identical methods (free energy calculations using GAFF and TIP3P water) shows signi1cant systematic deviations between predictions for many compounds.

Comparison of the calculated and experimental values for submissions v2q0t (InterX_GAFF_WET_OCTANOL), 6nmtt (MD-AMBER-wetoct), sqosi (MD-AMBER-dryoct) and physical reference calculations REF02 (YANK-GAFF-TIP3P-wet-oct) and REF07 (YANK-GAFF-TIP3P-dry-oct). (A) compares calculations that used wet octanol, and (B) compares those that used dry octanol. Plots C to F show the methods compared to one another. The dark and light-shaded region indicates 0.5 and 1.0 units of error, respectively.
