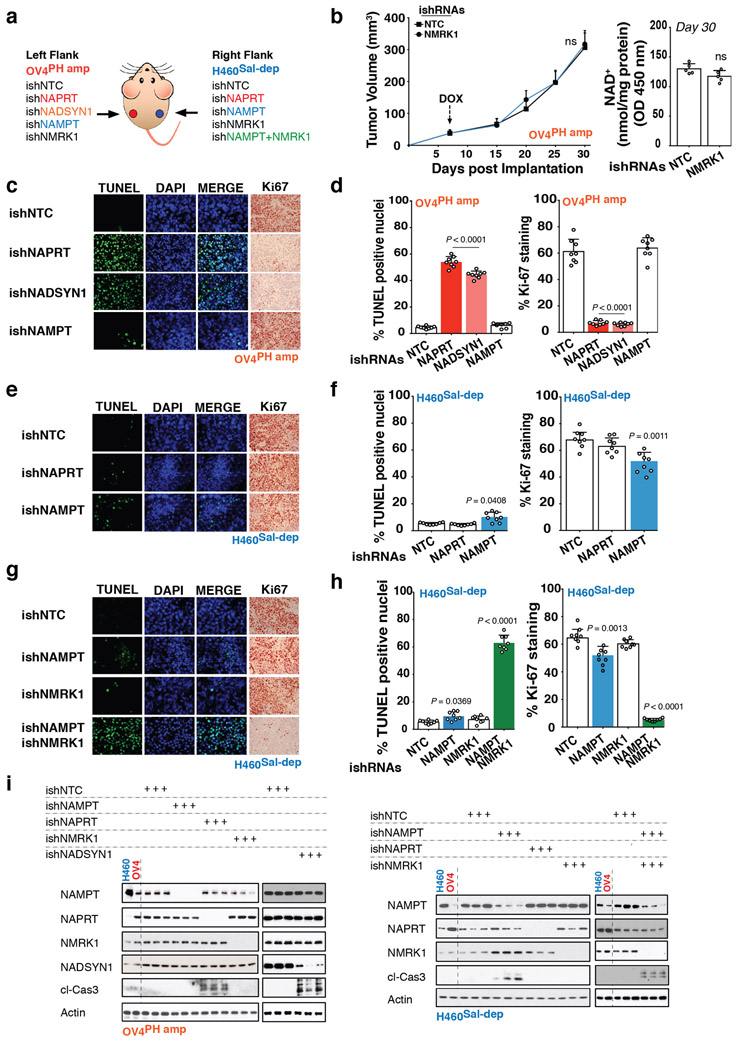
Extended Data Fig. 6: In vivo demonstration of NAD metabolic pathway dependencies.
a. Schematic diagram of experiment - OV4PH amp cells (Ovarian adenocarcinoma) stably expressing DOX-inducible shRNA either against NAPRT (ishNAPRT), NADSYN1 (ishNADSYN1), NAMPT (ishNAMPT) or NMRK1 (ishNMRK1) were inoculated into the left flank of nude mice. H460Sal-dep NSCLC cells stably expressing DOX-inducible shRNA either against NAPRT (ishNAPRT), NAMPT (ishNAMPT), NMRK1 (ishNMRK1) or both NAMPT (ishNAMPT) and NMRK1 (ishNMRK1) were inoculated into the right of the same nude mice. ishNTC was used as a non-targeting control inducible shRNA for both the tumor types. b. Tumor volume (left) and Intratumoral NAD+ measurement (right) of nude mice bearing OV4PH amp stably expressing DOX-inducible shRNA against NMRK1 (ishNMRK1) taken at the end of experiment on Day 30. Tumor volume was monitored over a 30-day period. DOX treatment was initiated on day 7 post implantation until the end of the experiment. c, e and g. Representative images illustrating TUNEL+ nuclei and Ki67+ cells from one of the two independent experiments. Both biological replicates showed similar results. d, f and h. Quantification for TUNEL+ nuclei and Ki67+ cells in tumor tissues from respective tumor types. DAPI was used to stain DNA for TUNEL staining. When measuring TUNEL+ nuclei, 10000-12000 cells were counted for each cohort, whereas for Ki67+ cells, 15000-20000 cells were counted for each cohort. I. Immunoblotting for cleaved-caspase 3 as a measure of cell-death and to test for protein abundance for NAMPT, NAPRT, NMRK1 and NADSYN1 in tumor tissues obtained from the indicated tumor types. Representative blots are from one of the two independent experiments. Both biological replicates showed similar results. Actin was used as a loading control. Data are representative of eight (b-left,d,f,h, n=8) and five (b-right, n=5) independent biological replicates. Mean tumor volume ± s.e.m is shown (n=8 tumors/cohort) with statistical significance assessed using two-way ANOVA to calculate significance on repeated measurements over time (b-left). Data as scatter plots with bars are represented as mean ± s.d, analysed by one-way ANOVA with Tukey’s multiple comparisons test (d,f,h). For gel source data, see Supplementary Fig. 1 ns, not significant.

