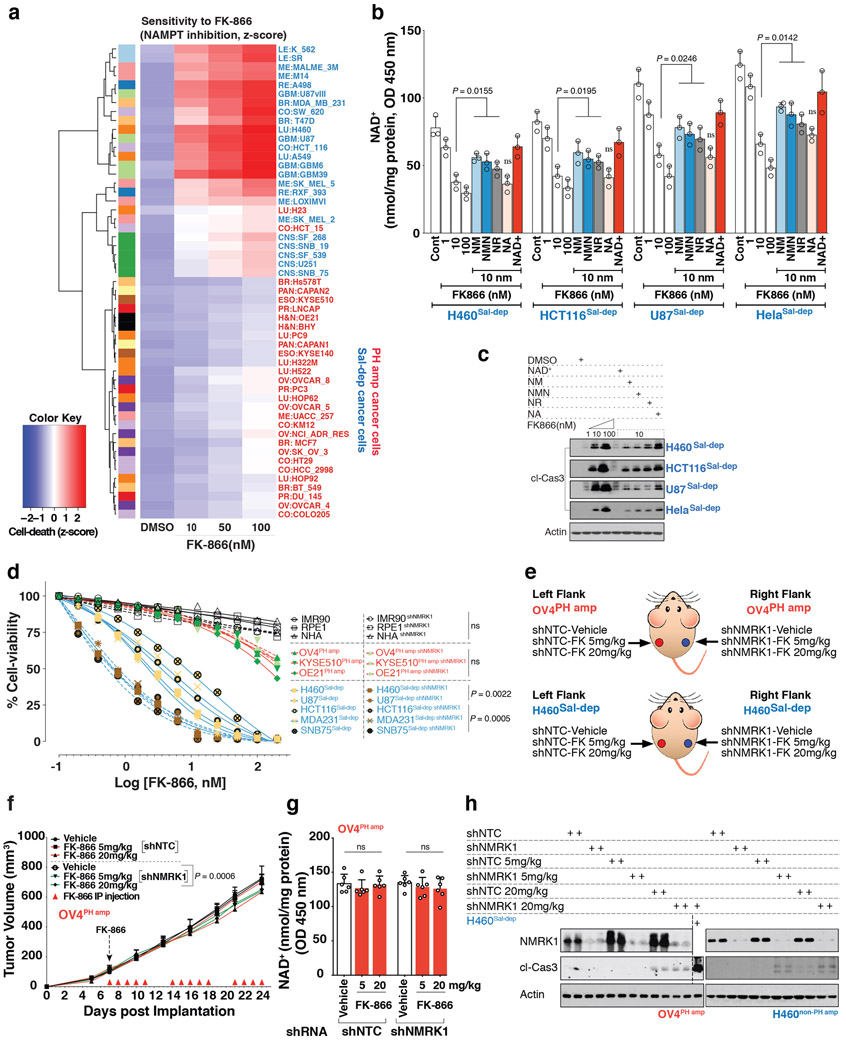
Extended Data Fig. 9: Genetic depletion of NMRK1 in non-PH amplified tumor cells enhances sensitivity to FK-866 inducing tumor cell death.
a. Heatmap illustrating cell death measured by Propidium Iodide staining (z-score). Cancer cells were treated with increasing doses of NAMPT inhibitor, FK-866 for 72 h. Cancer cells amplified for the PH-pathway enzymes (NAPRT or NADSYN1) are denoted as ‘PH amp’ marked in ‘red’, while cancer cells not amplified for NAPRT or NADSYN1 are denoted as ‘Sal-dep’ marked in ‘blue’. b. Intracellular NAD+ level measurement, and c. Immunoblotting for cleaved-caspase 3, in ‘Sal-dep’ cancer cells treated with 10nM FK-866 for 72 h. To rescue depleted (b) intracellular NAD+ pools and (c) apoptosis as measured by cleaved-caspase 3 abundance, cells were supplemented with exogenous NAD+ (200 μM) or with the indicated precursors, NM; NMN; NR or NA at a dose of 500 μM. d. Cell viability of non-cancer and cancer cells (PH amp and Sal-dep) stably silenced using shRNA against NMRK1 (shNMRK1) as the target gene, treated with increasing doses of FK-866 for 72 h. shNTC was used as a non-targeting control shRNA. e. Schematic diagram of experiment - OV4PH amp (top) and H460Sal-dep (bottom) cells stably expressing shRNA against the target gene NMRK1 (shNMRK1), implanted subcutaneously. shNTC was used as a non-targeting shRNA control for both the tumor types, f. Tumor volume of nude mice bearing stably engineered OV4PH amp cells implanted subcutaneously. Tumor volume was monitored over a 24-day period. Mice were IP injected with FK-866 twice daily, g. Intratumoral NAD+ measurement of nude mice bearing stably engineered OV4PH amp tumors, taken at the end of experiment on Day 24. h. Immunoblotting for cleaved-caspase 3 as a measure of cell-death and to test for protein abundance for NMRK1 in tumor tissues obtained from the indicated tumor types. Representative blots are from one of the two independent experiments. Both biological replicates showed similar results. Actin was used as a loading control (c,h). Data are representative of three (b,d, n=3), eight (f, n=8) and six (g, n=6) independent biological replicates. Data as scatter plots with bars are represented as mean ± s.d, analysed by one-way ANOVA with Tukey’s multiple comparisons test (b,g). Statistical significance for cell-viability data was assessed using two-tailed unpaired Student’s t-test (d). Mean tumor volume ± s.e.m is shown (n=8 tumors/cohort) with statistical significance assessed using two-way ANOVA to calculate significance on repeated measurements over time (f). For gel source data, see Supplementary Fig. 1. ns, not significant.

