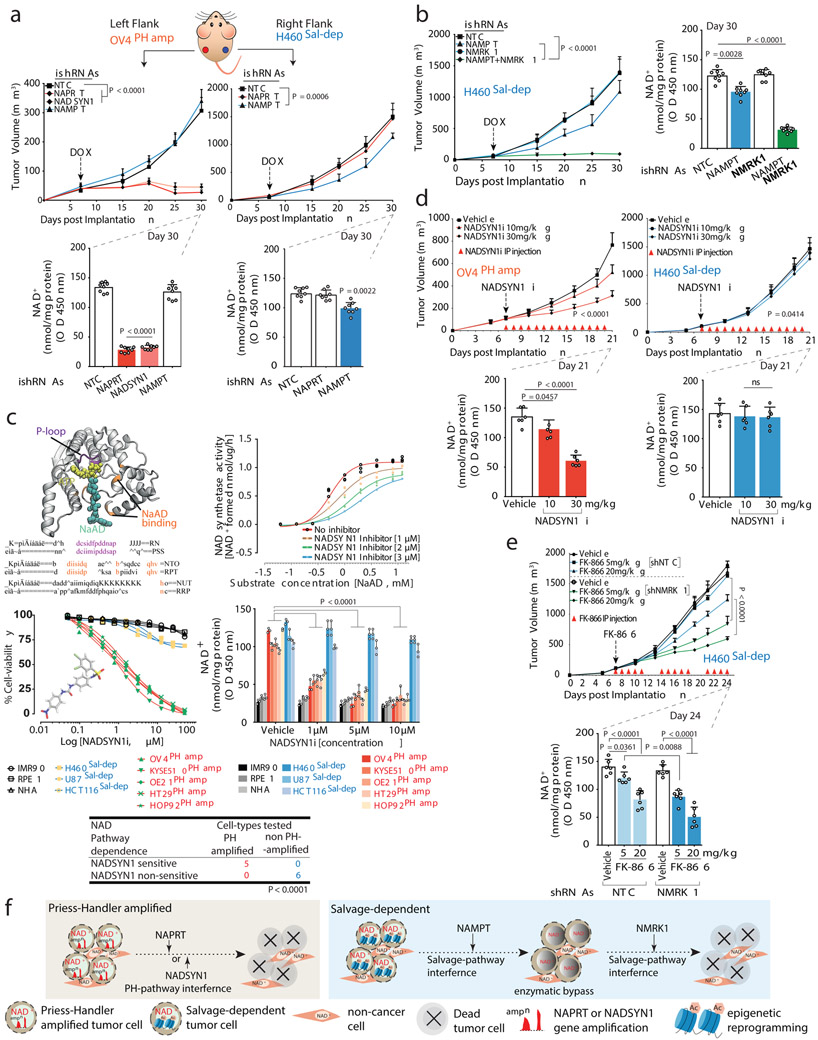
Fig. 4: PH-pathway survival addiction is not subject to enzymatic bypass, resulting in massive tumor cell death in vivo; epigenetically determined Salvage-pathway dependence is subject to resistance through enzymatic bypass.
a. Tumor volumes (top) of nude mice bearing engineered OV4PH-amp and H460Sal-dep cells implanted subcutaneously into the left or right flank. Intratumoral NAD+ levels (bottom). b. Tumor volume of nude mice bearing engineered H460Sal-dep cells implanted subcutaneously (left). Intratumoral NAD+ levels (right). c. Crystal structure of glutamine-dependent NAD synthetase from B. subtilis, bound to ATP and NaAD. Sequence alignment of P loop (purple) and NaAD binding sites (orange). NAD synthetase activity (top,right) of human recombinant enzyme. Cell viability (middle,left) of non-cancer and cancer cells treated with NADSYNi for 72 h. Intracellular NAD+ levels (middle, right) in non-cancer and cancer cell-lines (‘PH amp’ and ‘Sal-dep’) treated with NADSYN1i. Two-sided Fishers exact test (bottom). d. Tumor volumes (top) of nude mice bearing OV4PH-amp and H460Sal-dep cells implanted subcutaneously into the left or right flank. Mice were IP injected with NADSYN1i once daily. Intratumoral NAD+ levels (bottom). e. Tumor volume of nude mice bearing H460Sal-dep cells implanted subcutaneously into the right flank. Mice were IP injected with FK-866 twice daily. Intratumoral NAD+ levels (bottom). f. Schematic overview of the molecular basis of NAD metabolic pathway addiction in cancer. DOX treatment or drug administration was initiated on day 7 post implantation once the tumors were visible. Data are representative of eight (a,b,d,e: tumor volumes; a,b: NAD+ levels), six (d-e: NAD+ levels) and three (c) independent biological replicates. Mean tumor volume ± s.e.m is shown (n=8 tumors/cohort) with statistical significance assessed using two-way ANOVA to calculate significance on repeated measurements over time. Bar plots are represented as mean ± s.d, analysed by one-way ANOVA with Tukey’s multiple comparisons test (a-e).

