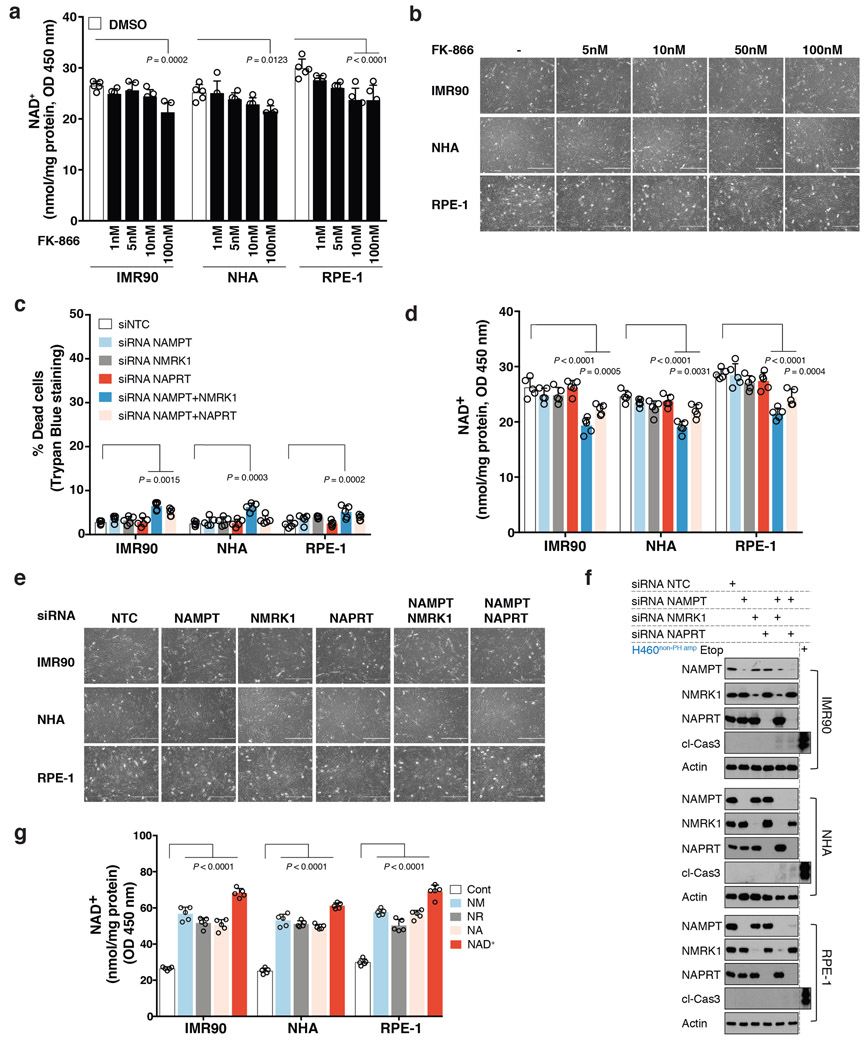
Extended Data Fig. 2: Non-cancer cells are not dependent on a single NAD biosynthetic pathway for survival.
a. Intracellular NAD+ level measurement in non-cancer cells upon treatment with increasing doses of NAMPT inhibitor FK-866 for 72 h. b. Representative images of non-cancer cells from one of the two independent experiments, treated with increasing doses of NAMPT inhibitor FK-866 for 72 h. Both biological replicates showed similar results. Images taken on 10X objective. c-f. Non-cancer cells transfected with siRNAs targeting NAMPT (siNAMPT); NMRK1 (siNMRK1) and NAPRT (siNAPRT) either individually or in combination. A non-targeting siNTC was used a negative control. c. Scattered data plots with bars representing (%) cell death assessed by trypan blue exclusion assay in non-cancer cells. d. Intracellular measurement of NAD+ levels in non-cancer cells. e. Representative images of non-cancer cells from one of the two independent experiments, transfected with siRNAs targeting NAMPT (siNAMPT); NMRK1 (siNMRK1) and NAPRT (siNAPRT) either individually or in combination. Both biological replicates showed similar results. Images taken on 10X objective. f. Immunoblotting for cleaved-caspase 3 as a measure of cell-death and to test for abundance of NAMPT, NMRK1 and NAPRT protein expression. Protein lysates from etoposide (Etop) treated H460 cancer cells was used as a control, when immunoblotting for cleaved-caspase 3. Actin was used as a loading control. Representative blots are from one of the two independent experiments. Both biological replicates showed similar results. g. Intracellular measurement of NAD+ levels in non-cancer cells supplemented with exogenous NAD+ (200 μM) or with the indicated precursors, NA; NM or NR at a concentration of 500 μM. Data are representative of five independent biological replicates, n=5 (a,c,d,g). Data are represented as mean ± s.d, analysed by one-way ANOVA with Tukey’s multiple comparisons test (a,c,d,g). For gel source data, see Supplementary Fig. 1.

