
Figure 4.
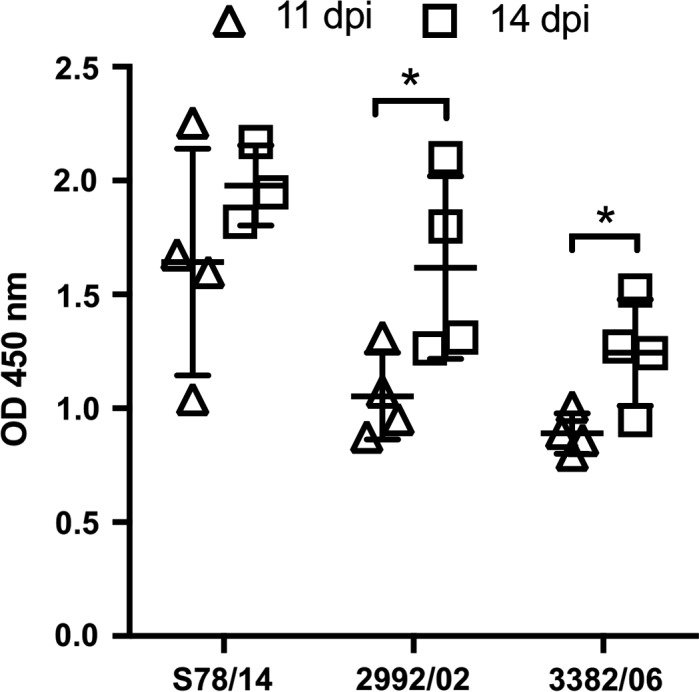
Serum antibodies of IBV variants‐infected chickens. Antibody responses post‐inoculation with different IBV strains were evaluated by ELISA. Chicken serum was collected at 11 and 14 dpi, respectively. Bars represent mean ± standard deviation (n = 3 or 4 chickens per group). *p < .05