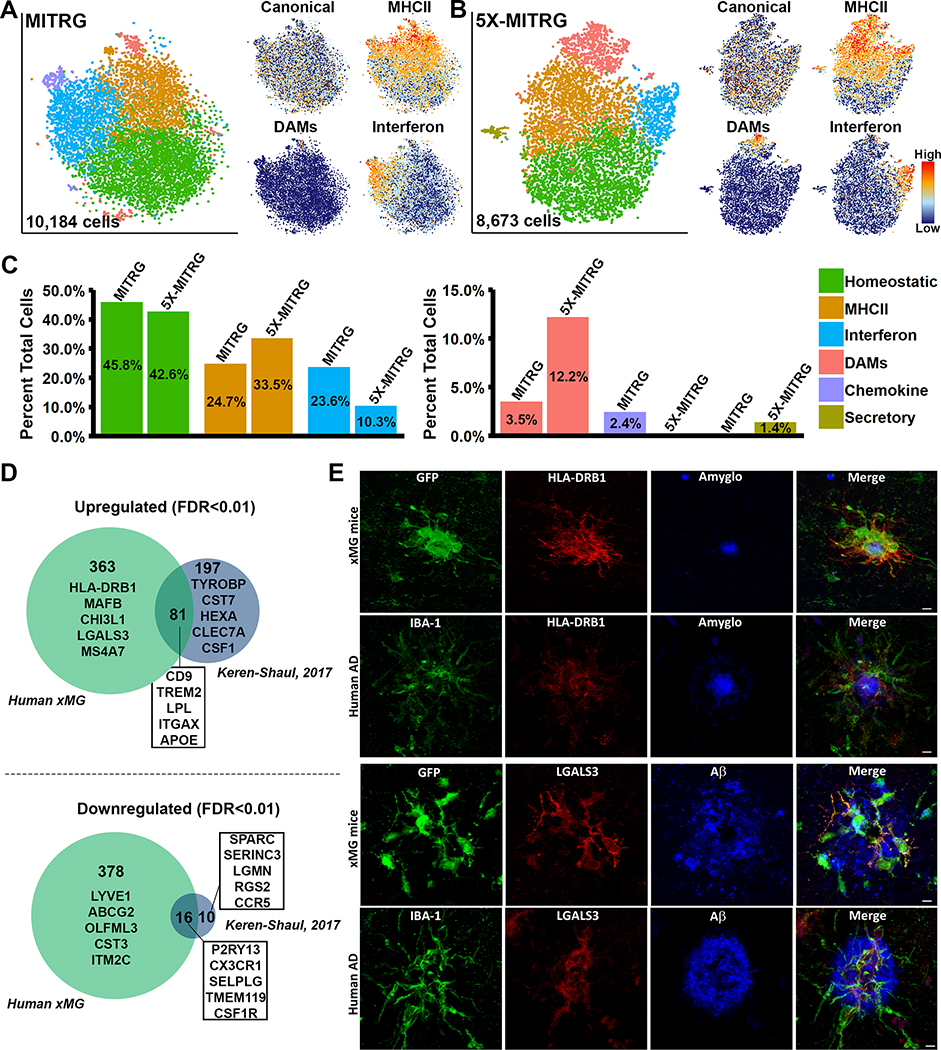
Figure 8. Single-cell sequencing of xMGs from MITRG and MITRG-5X mice reveals altered population distributions and human-specific genetic responses.
(A) tSNE plot of 10,184 xMGs isolated from 10.5-month-old MITRG mice (n=2) reveals multiple clusters defined by genes related to MHC class II (Orange; HLA-DRB1, HLA-DPB1, HLA-DQA1, and CD74), Type I Interferon (Blue; IFI6, IRF7, ISG15, STAT1, and IFIT3), DAMs (Salmon; CD9, TREM2, LPL, and ITGAX), Inflammatory chemokines (Purple; CCL2, CXCL10, CCL8, and CXCL11), and a “homeostatic” cluster (Green) that was mainly defined by a lack of activation markers. Additionally, canonical microglia markers (P2RY12, P2RY13, CX3CR1, and TMEM119) showed a uniform distribution across all clusters besides DAMs. (B) tSNE plot of 8,673 xMGs isolated from 10.5 and 12-month-old 5X-MITRG mice (n=4) reveals similar clusters to the MITRG xMGs. Exceptions include the addition of a secretory cluster (Olive; ANAX3, AGR2, PLAC8, and PLA2G7) the loss of a clearly defined chemokine cluster. (C) Bar plot comparing the percentage of total cells making up each cluster in WT MITRG and 5X-MITRG tSNE plots. (D) DAM genes, reported by Keren-Shaul et al. (2017), from 5XfAD murine microglia were filtered to contain only genes defined by Ensembl or NCBI Homologene to have 1:1 human orthologs. Remaining genes were then compared to the differentially expressed genes between DAM and homeostatic xMGs (FDR≤0.01) demonstrating that limited overlap exists between the human xMG and mouse DAM genes. (E) Protein-level validation of human-specific DAM genes HLA-DRB1 (top) and LGALS3 (bottom) in both 5X-MITRG and human AD brain sections. See also Figure S6 and Table S7.

