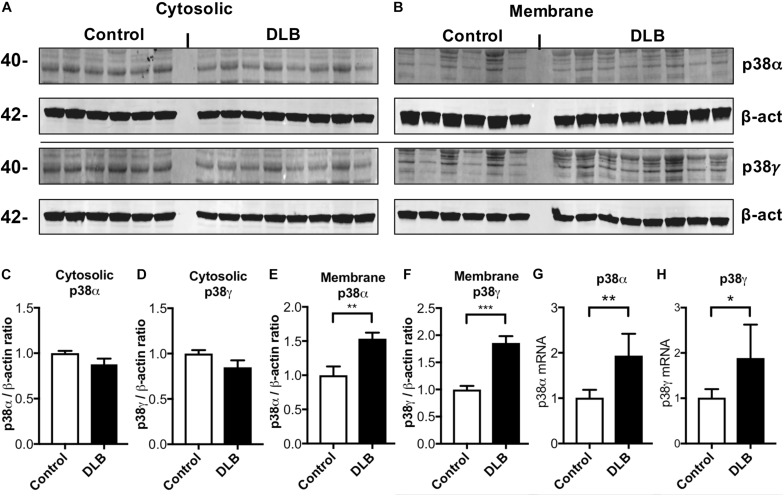
FIGURE 3.
Immunoblot and RNA analysis for p38α and γ in DLB and control brains. Human frontal cortex samples were separated into cytosolic and membrane fractions by extracting sequentially with Tris and PDGF buffer and probed with p38α, p38γ, and β-actin. (A,B) Representative immunoblot images for (A) cytosolic and (B) membrane fractions probed with p38α, p38γ, and β-actin. In each panel, left six lanes show healthy controls and right eight lanes show DLB patients. (C,D) Image analysis of the cytosolic fraction immunoblot for p38α and p38γ, respectively. (E,F) Image analysis of the membrane fraction immunoblot for p38α and p38γ, respectively. (G,H) Real time qPCR for p38α and p38γ mRNA, respectively. n = 6 for control and n = 8 for DLB (*p < 0.05, **p < 0.01, ***p < 0.001).

