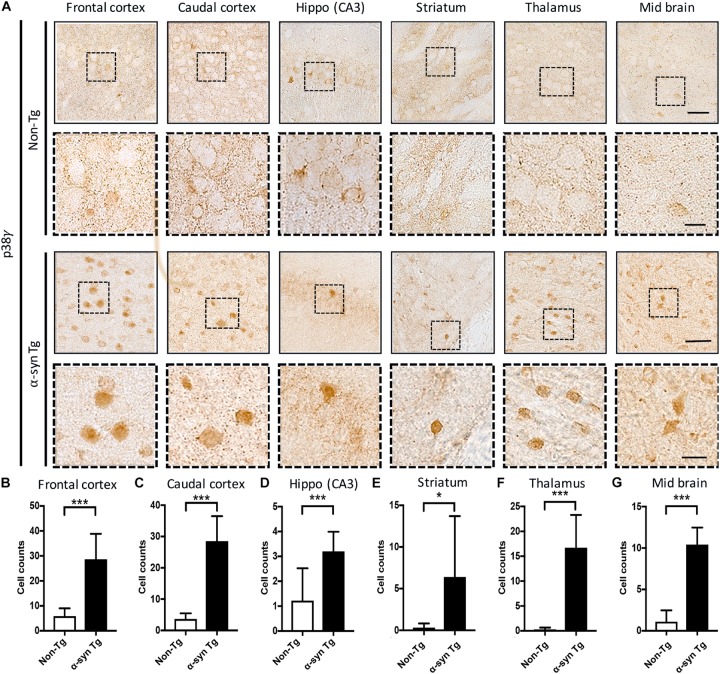
FIGURE 4.
Immunohistochemical analysis of the distribution of p38γ in brains in non-Tg and α-syn Tg mouse brains. Saggital vibratome sections from complete right hemibrains were immunolabeled with an antibody against p38γ and developed with DAB. (A) Panels with a solid outline show representative low power bright field microscopic images (200×) (scale bar = 100 μm) of non-Tg (top) and α-syn Tg (bottom) mouse brains immunostained with p38γ; panels with a dotted outline show enlarged images (630×) (scale bar = 20 μm) of the indicated region of interest. (B–G) Number of p38γ-positive cells per 1 mm2 of the frontal cortex (B), caudal cortex (C), hippocampus (D), striatum (E), thalamus, (F) and mid brain (G). n = 6 per group (*p < 0.05, ***p < 0.001).

