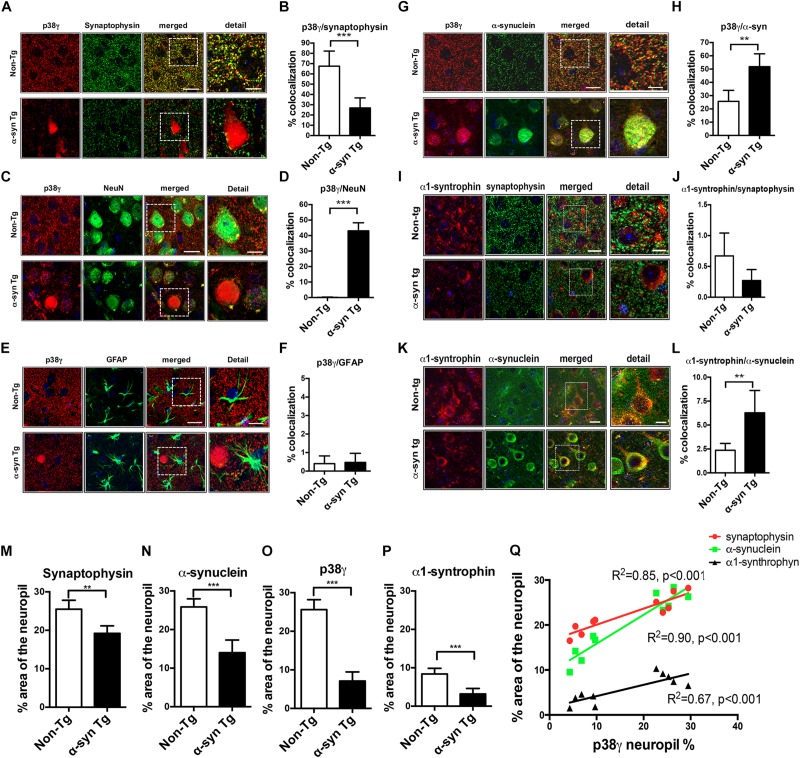
FIGURE 5.
Double immunohistochemical analysis of p38γ cellular localization in non-Tg and α-syn Tg mouse brains. Vibratome sections of murine brains were double immunofluorescence labeled and analyzed with Apotome II mounted in a Carl Zeiss AxioImager Z1 microscope. Far right (detail): enlarged image of the area contained in the dotted square. (A) p38γ (red) and the pre-synaptic marker synaptophysin (green), colocalization between the two markers is in yellow; (B) image analysis showing high colocalization of p38γ to synapses in non-Tg mice; (C) p38γ (red) and the neuronal marker NeuN (green); (D) image analysis showing increased localization of p38γ to neurons in α-syn Tg mice; (E) p38γ (red) and the astroglial cell marker GFAP (green); (F) image analysis showing minimal localization of p38γ to astroglia in mouse brains; (G) p38γ (red) and α-syn (green); (H) image analysis showing high colocalization of p38γ to α-syn aggregates in the cytoplasm (Lewy body-like) in α-syn Tg mice. (I) α1-syntrophin (red) and pre-synaptic marker synaptophysin (green); (J) image analysis showing low colocalization of α1-syntrophin to pre-synaptic site in mice brains; (K) α1-syntrophin (red) and α-synuclein (green); (L) image analysis showing high localization of α1-syntrophin with α-syn in α-syn Tg mice; Scale bars are 10 μm in the standard panels and 5 μm in the zoomed panels. n = 6 per group (∗∗p < 0.01, ∗∗∗p < 0.001). Image analysis of p38γ and synaptic proteins in α-syn Tg mouse brains. The single labeled channels from above were further analyzed to calculate the% area of the neuropil occupied by (M) synaptophysin, (N) α-syn, (O) p38γ, and (P) α1-syntrophin immunofluorescence in non-Tg and Tg mice. (Q) Linear regression analysis was performed to ascertain the correlation coefficient between the levels of p38γ in the neuropil (% area) and synaptophysin, α-syn, and α1-syntrophin in non-Tg and Tg mice. n = 6 per group (**p < 0.01, ***p < 0.001).

