FIGURE 6.
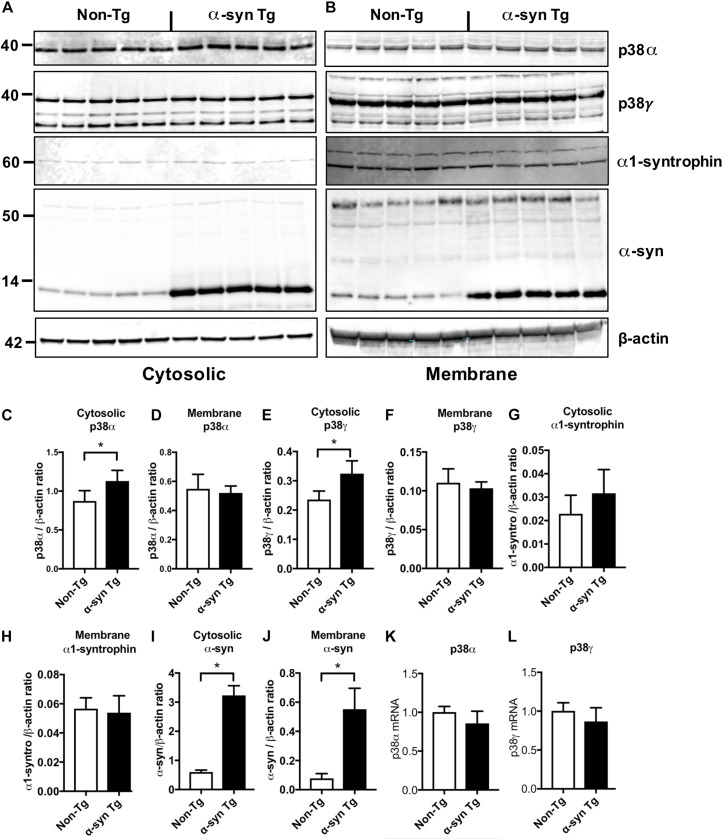
Immunoblot and RNA analysis in non-Tg and α-syn Tg mouse brains. Mouse hemibrains were separated into cytosolic and membrane fractions by extracting sequentially with Tris and PDGF buffer and probed with p38α, p38γ, α1-syntrophin, α-syn, and β-actin. (A,B) Representative immunoblot images for (A) cytosolic and (B) membrane fractions probed with p38α, p38γ, α1-syntrophin, α-synuclein, and β-actin. In each panel, left five lanes show non-Tg mice and right lanes show α-syn Tg mice. (C,D) Image analysis of cytosolic and membrane fractions probed for p38α, respectively; (E,F) image analysis of cytosolic and membrane fractions probed for p38γ, respectively; (G,H) image analysis of cytosolic and membrane fractions probed for α-1 syntrophin, respectively (I,J) image analysis of cytosolic and membrane fractions probed for α-synuclein, respectively; (K,L) real time quantitative PCR analysis showed no significant differences in p38α (K) and p38γ (L) RNA expression between non-Tg and α-syn Tg mice. n = 5 per group (*p < 0.05).

