Figure 2.

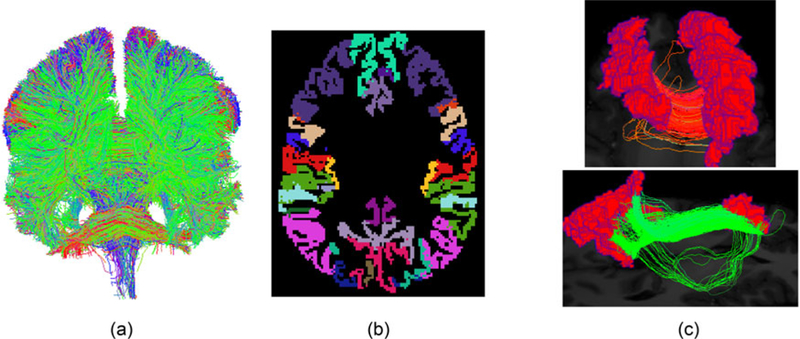
(a) One example of the whole tractography dataset for a brain. (b) The Desikan–Killiany parcellation of the cortical region. (c) Fiber curves connecting a pair of regions.

(a) One example of the whole tractography dataset for a brain. (b) The Desikan–Killiany parcellation of the cortical region. (c) Fiber curves connecting a pair of regions.