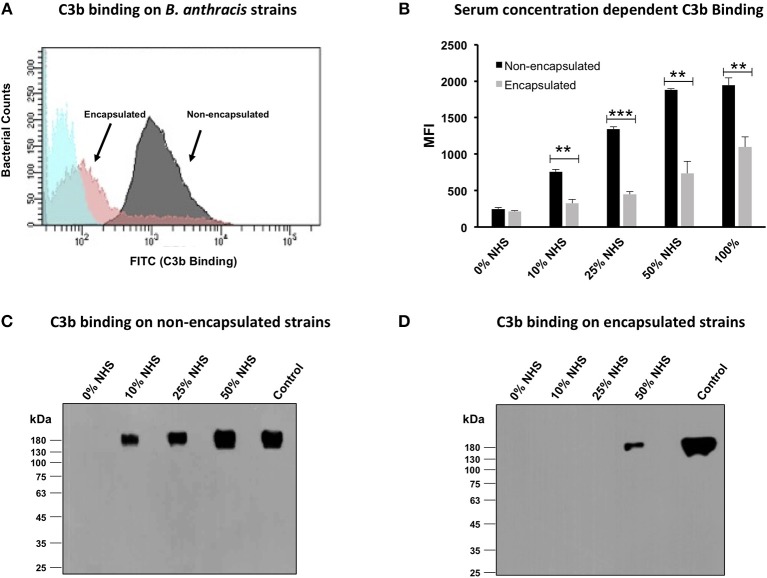
Figure 2.
C3b deposition on encapsulated and non-encapsulated strains of Bacillus anthracis. (A) Flow cytometry histogram of C3b deposition on encapsulated and non-encapsulated B. anthracis strains incubated in 10% human serum. Gray and pink shading indicates non-encapsulated and encapsulated bacteria, respectively. Blue shading indicates bacteria incubated in phosphate-buffered saline (PBS) alone. (B) Mean fluorescence index (MFI) of serum concentration-dependent C3b deposition on encapsulated and non-encapsulated bacteria. Black and gray bars represent non-encapsulated and encapsulated strains, respectively. The scatter plots for the corresponding histograms are represented in Figure S3. (C,D) Immunoblot assays to detect serum concentration-dependent C3b deposition on non-encapsulated (C) and encapsulated strains (D); 1% normal human serum was used as positive control. Each data point represents the mean of three independent experiments. Error bars represent standard error of the mean. Statistical significance is highlighted by the following denotations: ** for P-value < 0.01, and *** for P-value < 0.001.

