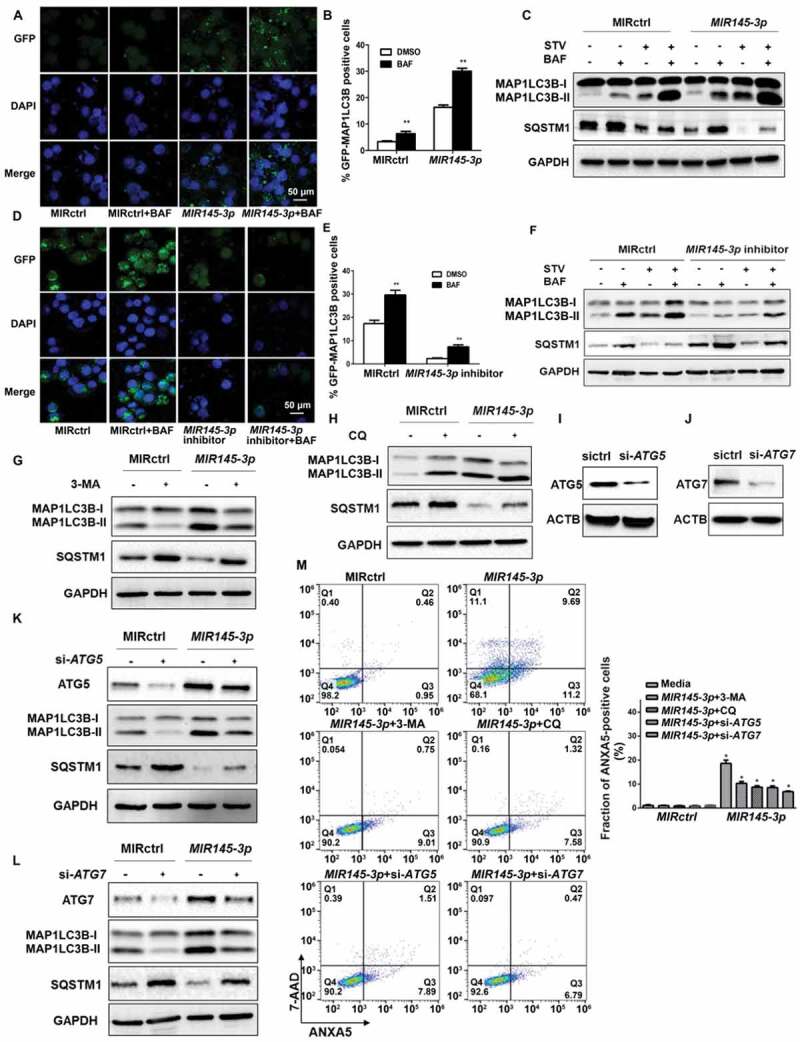
Figure 3.

MIR145-3p induces autophagic flux in MM cells. (A) LP-1 cells expressing GFP-MAP1LC3B were transfected with MIR control (MIRctrl) or MIR145-3p and were treated with or without lysosomal inhibitor bafilomycin A1 (BAF) (20 nM) for 4 h. Then cells were visualized with a fluorescence microscope. Representative images are shown. (B) Quantitative analysis of the experiments in (A) (mean ± SD of independent experiments, n = 3, **P < 0.01.). (C) LP-1 cells were transfected with MIRctrl or MIR145-3p mimic, and then incubated with normal or starvation (STV) medium Earle’s balanced salt solution (EBSS) as indicated for 2 h, in the absence or presence of 20 nM BAF. Whole-cell extracts were subjected to immunoblotting with anti-MAP1LC3B and SQSTM1 antibodies. GAPDH was used as loading control. The experiments were performed in triplicate. (D) KM3 cells expressing GFP-MAP1LC3B were transfected with MIRctrl or MIR145-3p inhibitor and were treated with or without BAF (20 nM) for 4 h. Then cells were visualized with a fluorescence microscope. Representative images are shown. (E) Quantitative analysis of the experiments in (D) (mean ± SD of independent experiments, n = 3, **P < 0.01.). (F) KM3 cells were transfected with MIRctrl or MIR145-3p inhibitor, and then incubated with normal or STV as indicated for 2 h, in the absence or presence of 20 nM BAF. Whole-cell extracts were subjected to immunoblotting with anti-MAP1LC3B and SQSTM1 antibodies. GAPDH was used as loading control. The experiments were performed in triplicate. (G and H) LP-1 cells were transfected with MIRctrl or MIR145-3p, and then treated with the autophagy inhibitors 3-MA (50 mmol/L) or CQ (50 nmol/L). Cells were lysed and extracted. Western blotting was performed to detect the expression levels of MAP1LC3B and SQSTM1. GAPDH was used as loading control. The experiments were performed in triplicate. (I and J) Western blot showing the effect of silencing ATG5 and ATG7, whole-cell extracts were subjected to immunoblotting with anti-ATG5 and ATG7 antibodies. ACTB (actin beta) was used as loading control. The experiments were performed in triplicate. (K and L) LP-1 cells were transfected with MIRctrl or MIR145-3p first, and then transfected with siRNA-ATG5 or siRNA-ATG7. Cells were lysed and extracted. Western blotting was performed to detect the expression levels of ATG5, ATG7, MAP1LC3B and SQSTM1, respectively. GAPDH was used as loading control. The experiments were performed in triplicate. (M) LP-1 cells were transfected with MIRctrl or MIR145-3p first, and then treated with 3-MA (50 mmol/L) and CQ (50 nmol/L) or transfected with siRNA-ATG5 and siRNA-ATG7. Cells were analyzed by flow cytometry after ANXA5-7-AAD staining. The percentage of ANXA5-positive cells was presented as mean ± SD from 3 independent experiments (*P < 0.05; **P < 0.01) .
