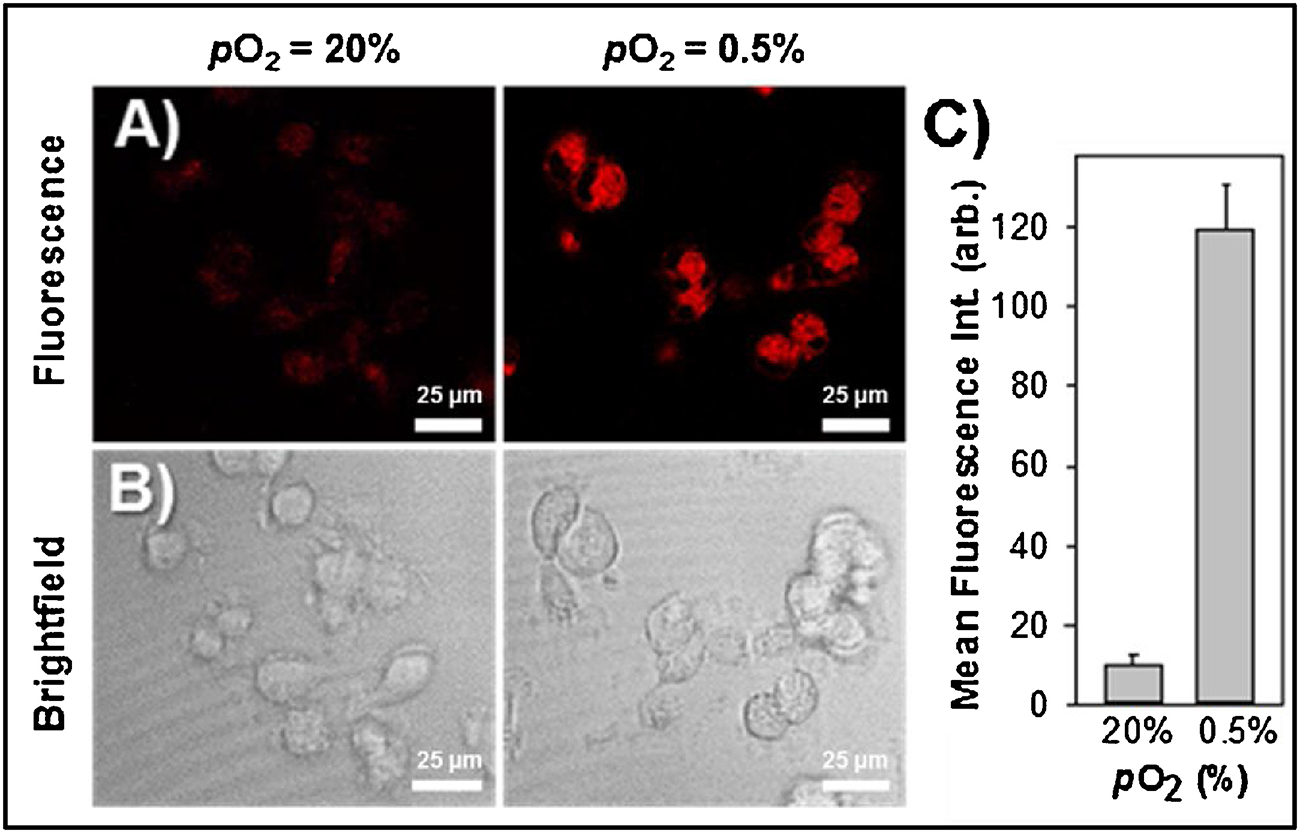
Figure 6. Evaluation of NO2-Rosol in live cells under normoxic and hypoxic conditions.

Confocal fluorescence microscopy of NO2-Rosol (10 μM) in U251 cells incubated under normoxic (pO2 = 20%) and hypoxic (pO2 = 0.5%) conditions. A) Fluorescence imaging (top panels). Emission was collected from 650–800 nm (λex = 550 nm). B) Brightfield imaging (bottom panels). Scale bar = 25 μm. C) Quantitative analysis of the mean cell fluorescence intensity. N = 50, P < 0.0001
