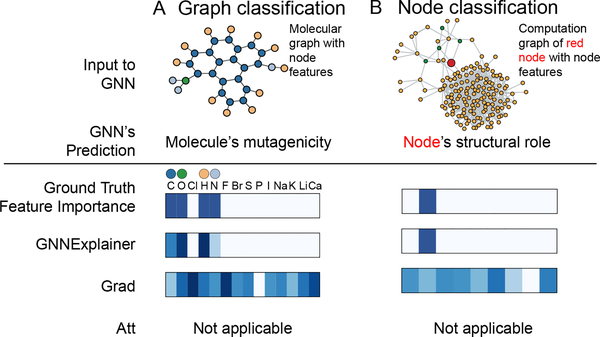
Figure 5:
Visualization of features that are important for a GNN’s prediction. A. Shown is a representative molecular graph from Mutag dataset (top). Importance of the associated graph features is visualized with a heatmap (bottom). In contrast with baselines, GnnExplainer correctly identifies features that are important for predicting the molecule’s mutagenicity, i.e. C, O, H, and N atoms. B. Shown is a computation graph of a red node from BA-Community dataset (top). Again, GnnExplainer successfully identifies the node feature that is important for predicting the structural role of the node but baseline methods fail.

