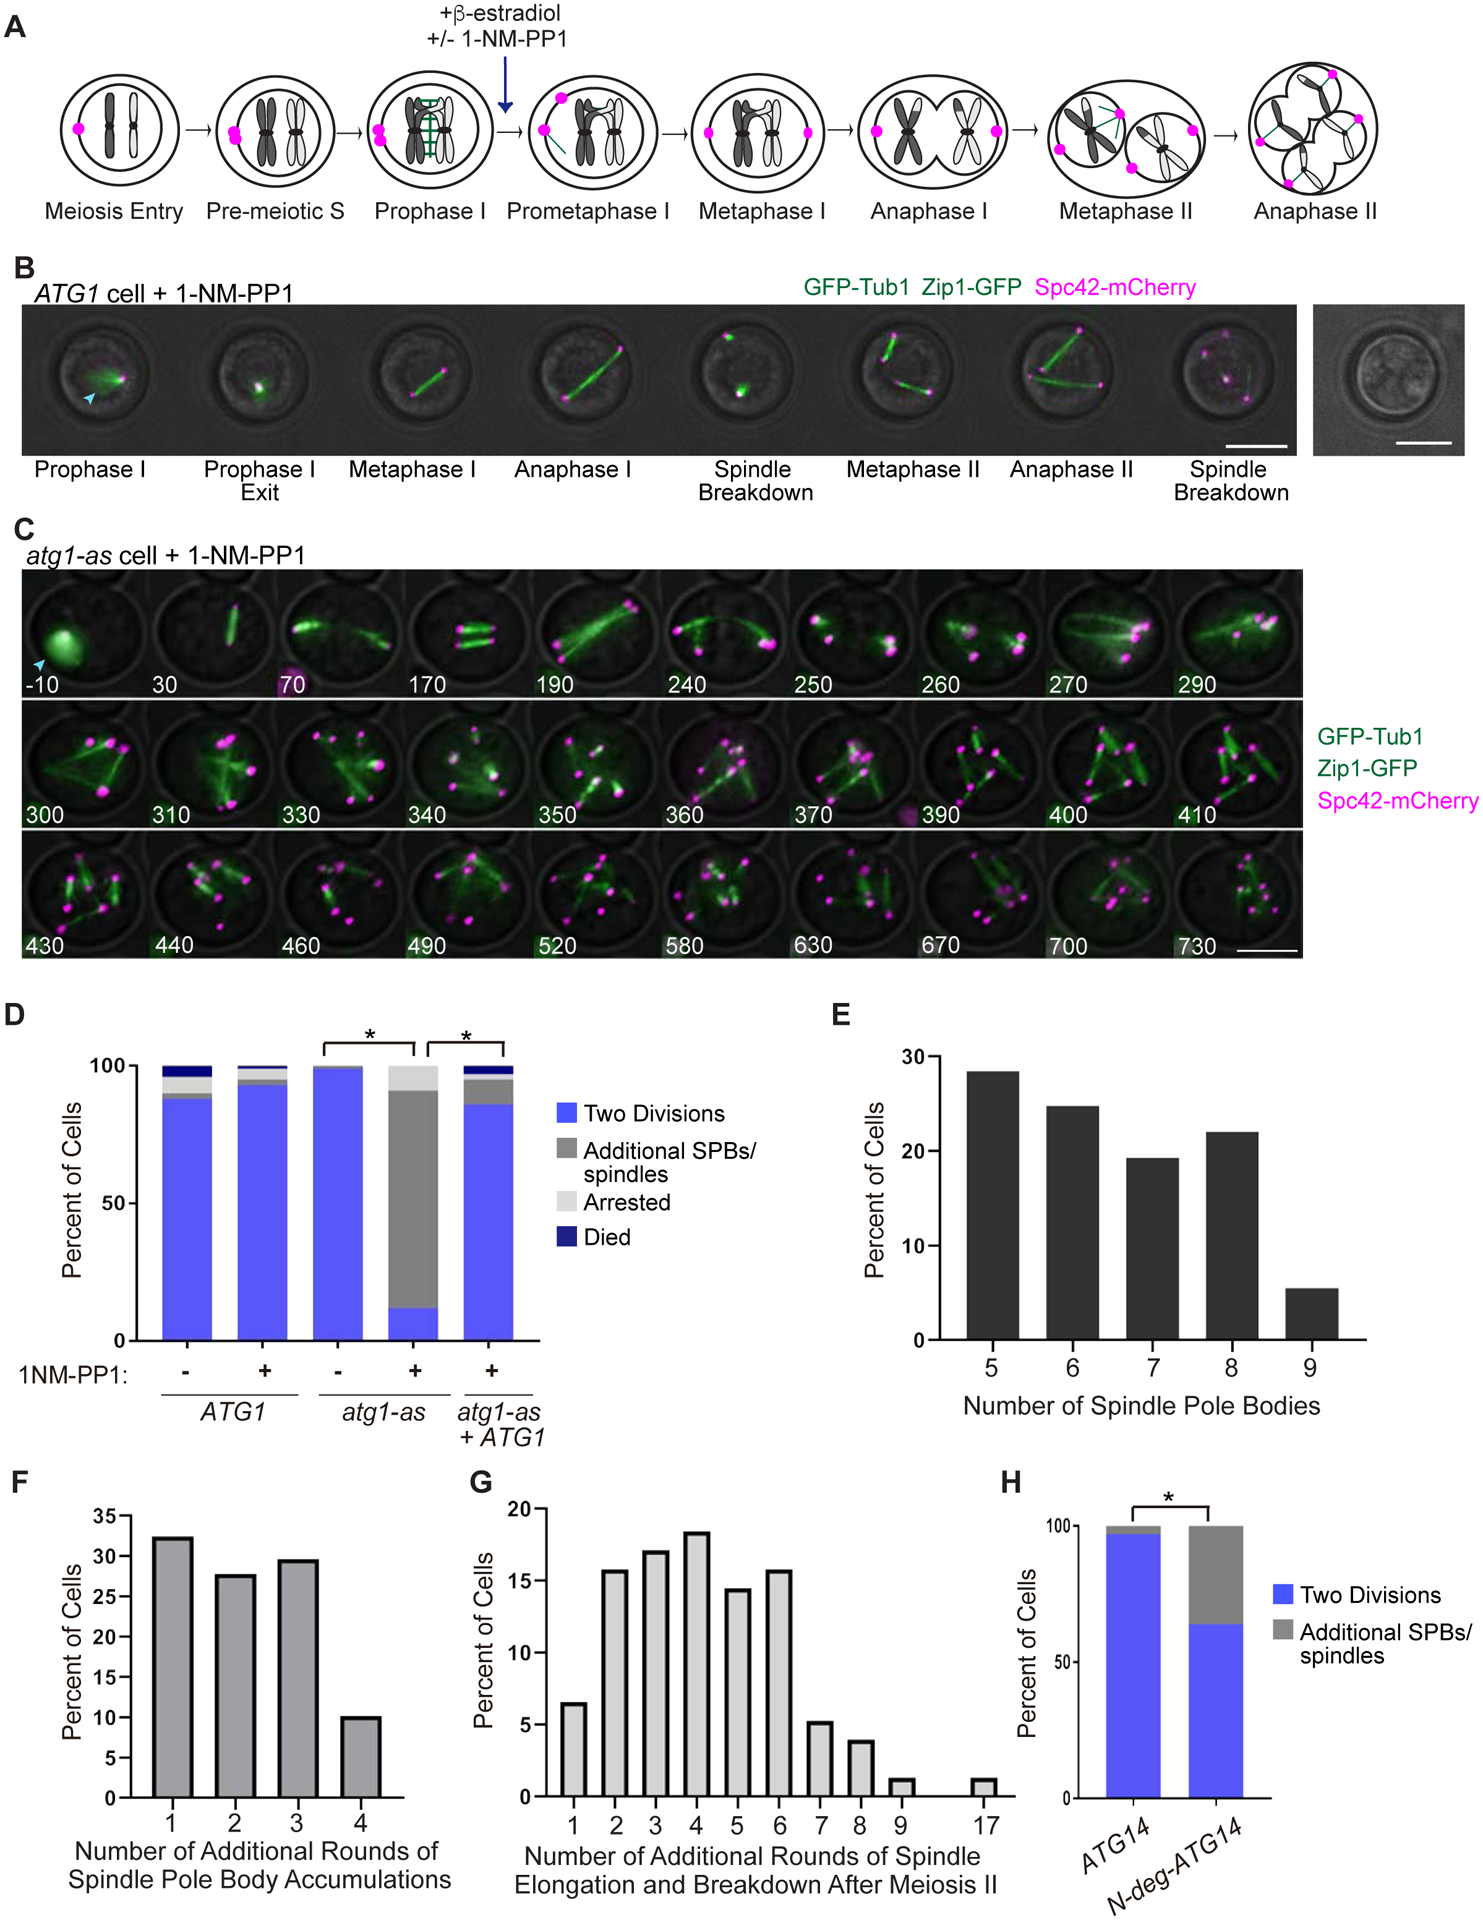
Figure 1: Autophagy inhibition causes additional rounds of spindle formation and breakdown after meiosis II.

A) Cartoon showing cell cycle stages of budding yeast meiosis with synchronization by NDT80-in and release from prophase I arrest by β-estradiol addition. Unless indicated otherwise, 1-NM-PP1 was always added to meiotic cells at the time of arrest release. B) Representative time-lapse images of a wildtype (ATG1) cell undergoing synchronized meiosis in the presence of 1-NM-PP1. Also pictured, a brightfield image of spores at the end of the time-lapse. Blue arrowhead shows Zip1-GFP. Scale Bar: 5μm. C) Representative time-lapse images of an atg1-as cell undergoing synchronized meiosis in the presence of 1-NM-PP1. Blue arrowhead shows Zip1-GFP. Scale Bar: 5μm. D) Percent of wildtype, atg1-as, and atg1-as + ATG1 cells that underwent the indicated synchronized meiotic outcome in the absence or presence of 1-NM-PP1. The atg1-as + ATG1 cells have a transgenic copy of ATG1 under the control of a β-estradiol-inducible promoter (McIsaac et al., 2014). Only cells that were in prophase I (with Zip1-GFP) at the time of arrest release were analyzed. Asterisk represents statistically significant differences (n = >100 cells and 3 independent experiments for each genotype; p <.01, rx Contingency Tables). E) Graph of cells that had additional SPBs showing the percent of cells with the indicated number of additional SPBs (n=100 cells). F) Graph of cells that had additional SPBs, showing the percent of cells with the indicated number of additional rounds of SPB accumulations (n=100 cells). G) Graph of cells that had additional rounds of spindle formation, elongation, and breakdown after meiosis II, showing the percent of cells with the indicated number of additional rounds (n=100 cells). H) Percent of ATG14 NDT80-in and N-deg-ATG14 NDT80-in cells that underwent the indicated synchronized meiotic outcome. Note that both genetic backgrounds have a β-estradiol-inducible TEV protease that enables activation of the N-degron in the latter strain (Taxis and Knop, 2012). Only cells that were in prophase I (with Zip1-GFP) at the time of arrest release were analyzed. Asterisk represents statistically significant differences (n = >100 cells for each; p <.01, Fisher’s exact test).
