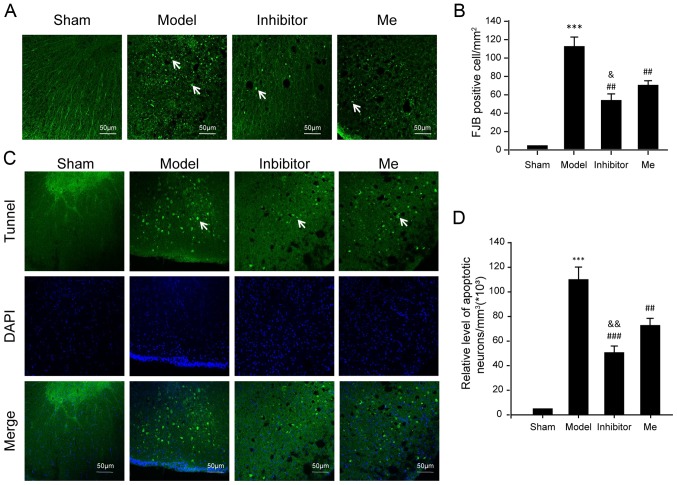
Figure 5.
Evaluation of neuronal death. (A) Neuronal death was examined by FJB staining. FJB-positive (green) cells per mm2 were quantified accordingly. (B) The data was represented as mean ± SD. ***P<0.01 vs. sham; ##P<0.01 vs. Injury; and &P<0.05 vs. Me. Scale bar, 50 μm. n=10. (C) Neuronal apoptosis was examined by a TUNEL assay using immunofluorescence. In each section, apoptotic neurons were labeled by TUNEL (green), while nuclei were labeled with DAPI (blue). TUNEL-nuclei positive neurons per mm3 were (D) quantified accordingly. The data are presented as the mean ± SD. White arrows indicate positive signals. ***P<0.01 vs. sham; ##P<0.01 and ###P<0.001 vs. injury; and &&P<0.01 vs. Me. Scale bar, 50 μm. n=10. TUNEL, terminal deoxynucleotidyl transferase-mediated dUTP nick-end labeling; FJB, fluoro jade B; DAPI, 4′,6-diamidino-2-phenylindole; SD, standard deviation; SCI, spinal cord injury; CX3CL1, C-X3-C motif chemokine ligand 1CX3CR1, C-X3-C motif chemokine receptor 1; Me, methylprednisolone.

