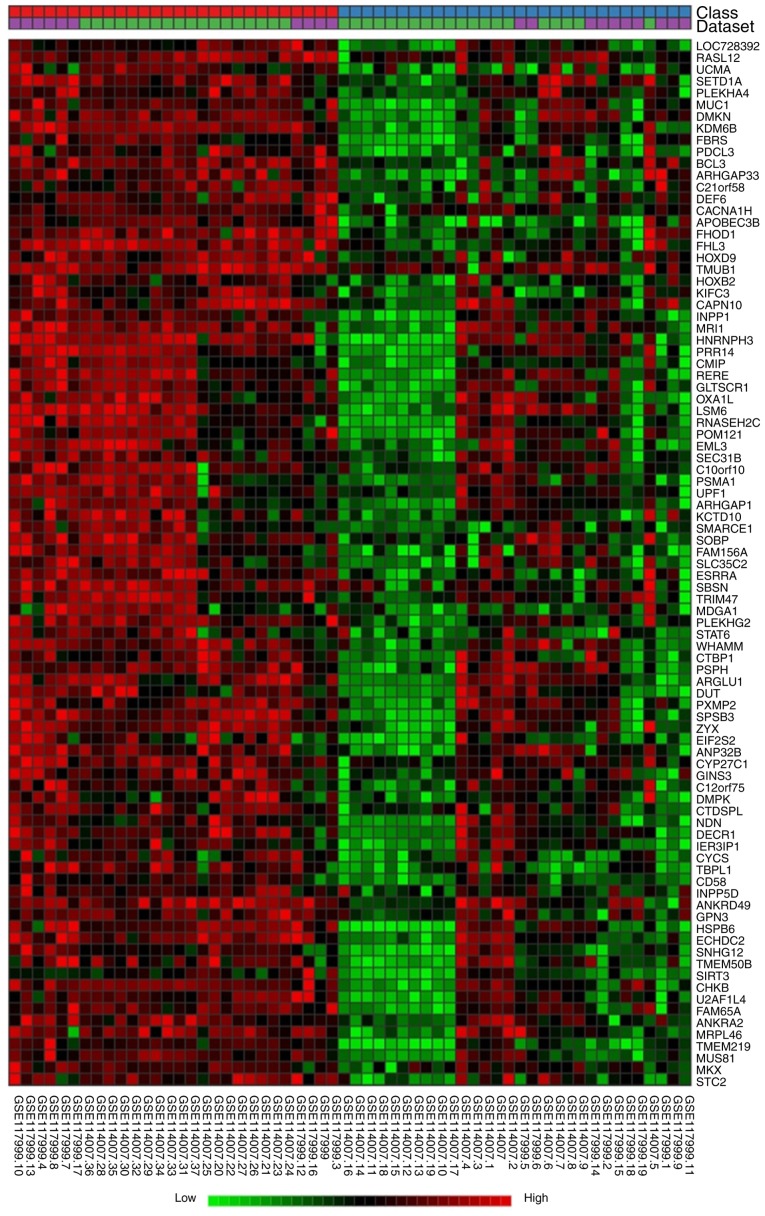
Figure 3.
Heat map of differentially expressed genes in the cartilage of patients with OA. The hierarchical cluster was performed using NetworkAnalyst. The top two rows represent the classification of samples and datasets; red squares represent non-OA samples, blue squares represent OA samples, purple squares indicate data from GSE117999 and green squares indicate data from GSE114007. The columns represent 58 cartilage samples and the rows represent a part of the heatmap of differentially expressed mRNAs and microRNAs. Colored pixels represent changes in the expression levels: Green, downregulated; black, no change; red, upregulated. OA, osteoarthritis.

