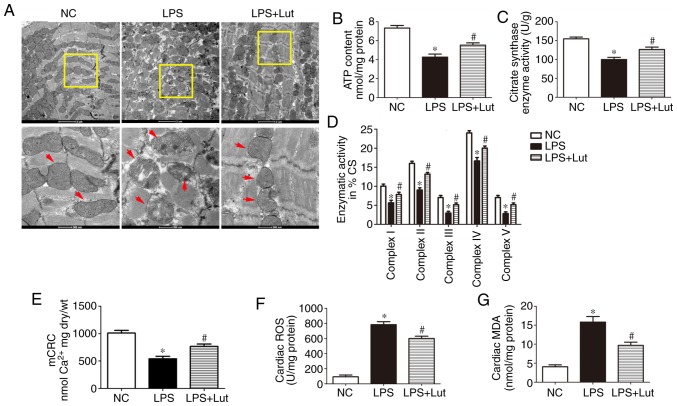
Figure 4.
Effects of Lut on mitochondrial function in LPS-induced septic mice. (A) Representative transmission electron micrographs of left ventricular specimens (magnification, ×8,200 and ×26,500, the red arrows indicate mitochondria). (B) ATP content and (C) CS and (D) complex I/II/III/IV/V activities in mitochondria isolated from mice. (E) mCRC. (F) ROS and (G) MDA levels. The columns and error bars represent the means and standard error of the mean (n=5). *P<0.05 vs. NC; #P<0.05 vs. LPS. LPS, lipopolysaccharides; MDA, malondialdehyde; NC, negative control; mCRC, mitochondrial calcium retention capacity; CS, citrate synthase; ROS, reactive oxygen synthase; Lut, luteolin.

