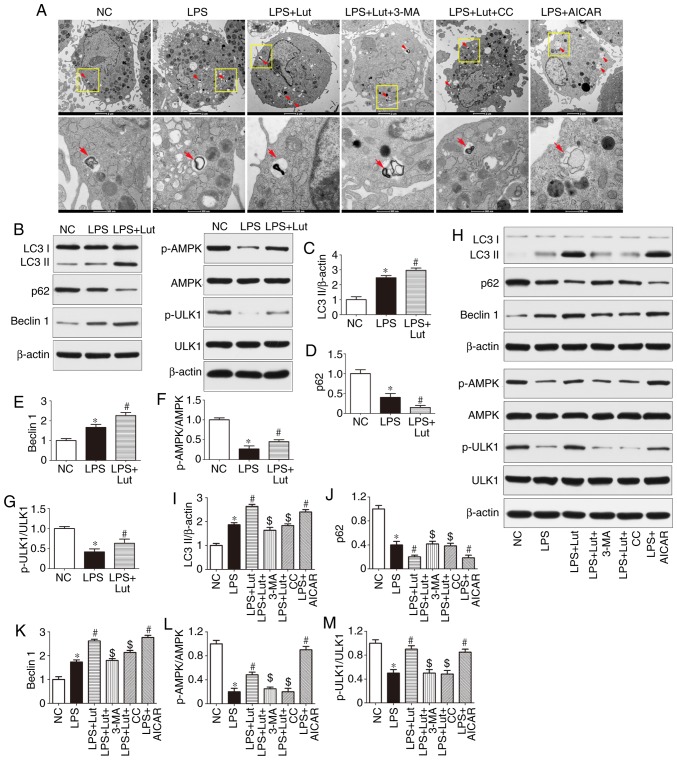
Figure 5.
Effects of Lut on autophagy in the hearts of septic mice and in LPS-treated cardiomyocytes. (A) Representative images of ultrastructural morphology and typical autophagosomes in cardiomyocytes subjected to different treatments (magnification, ×6,000 and ×43,000, the red arrows indicate autophagosomes). (B) Representative immunoblots and densitometric quantification for (C) LC3II, (D) P62, (E) Beclin1, (F) p-AMPK, AMPK, (G) p-ULK1, ULK1, and β-actin in myocardial tissues from the indicated groups. The columns and error bars represent the means and SEMs (n=5). *P<0.05 vs. NC; #P<0.05 vs. LPS. (H) Representative immunoblots and densitometric quantification for (I) LC3II, (J) P62, (K) Beclin1, (L) p-AMPK, AMPK, (M) p-ULK1, ULK1, and β-actin in cardiomyocytes from the indicated groups. The columns and error bars represent the means and SEMs. *P<0.05 vs. NC; #P<0.05 vs. LPS; $P<0.05 vs. LPS + Lut. p62, sequestosome 1; LC3II, microtubule-associated protein light chain 3II; AMPK, AMP-activated protein kinase; ULK1, Unc-51 like autophagy activating kinase 1; 3-MA, 3-methyladenine; AICAR, 5-aminoimidazole-4-carboxamide ribonucleotide; CC, dorsomorphin, compound C; p-, phosphorylated; SEM, standard error of the mean; NC, negative control; Lut, luteolin.

