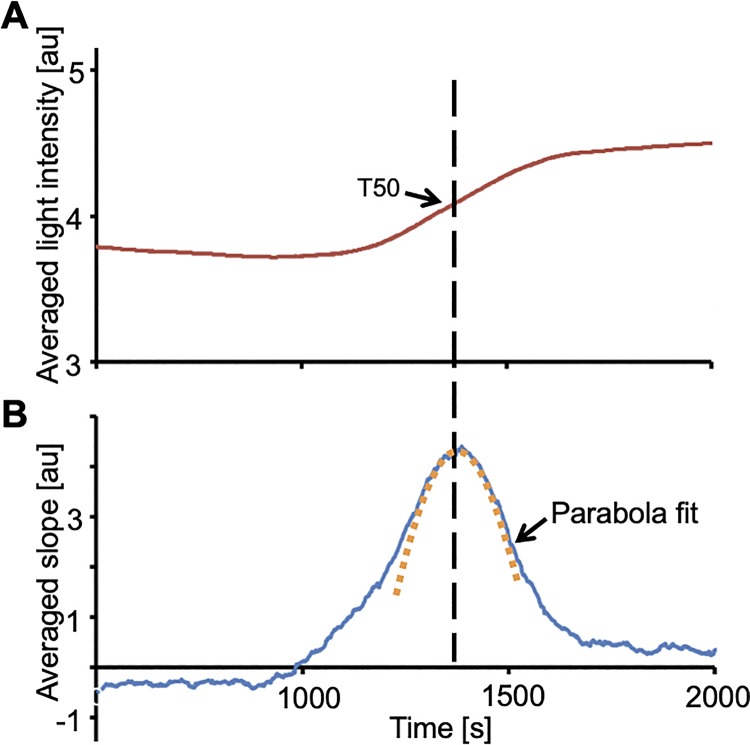
Fig 3. Determination of T50-value by a parabola fit to the first order derivative of light intensity transmitted through the sample.
A, The red line represents the smoothed light intensity plotted against time. B, The blue line corresponds to the first order derivative of the light intensities. T50 corresponds to the vertex of the parabola determined by a χ2-fit, which is shown as an orange dotted line.

