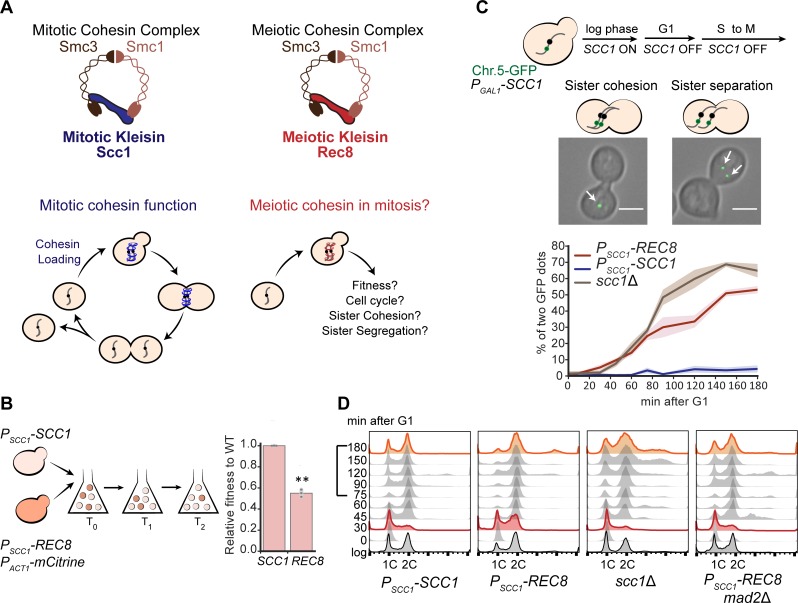
Fig 1. Expressing Rec8 in place of Scc1 impairs the mitotic cell cycle and sister chromosome cohesion.
(A) A diagram of the mitotic and meiotic cohesin complexes. Mitotic cohesin holds replicated sister chromosomes together in mitosis. We investigated the ability of the meiotic cohesin to support mitosis. (B) The fitness of Rec8-expressing cells is 55% of a wild-type strain expressing Scc1. The Rec8-expressing strain expressed a fluorescent marker (PACT1-mCitrine) and was competed against wild type. The fitness of Rec8-expressing cells relative to wild type was calculated as changes in the ratio of these two strains over multiple generations. In the right panel, the darker gray points represent the values of three biological replicates, and the thinner gray bar represents one standard deviation on each side of the mean of these measurements. (two-tailed Student t test, **p < 0.01). (C) The Rec8-expressing strain cannot maintain sister chromosome cohesion in mitosis. All the strains (PSCC1-REC8, PSCC1-SCC1, and scc1Δ) carried a PGAL1-SCC1 copy integrated in the genome to allow the acute effect of altered kleisin expression to be analyzed. To examine sister chromosome cohesion in a single cell cycle, Scc1 expression was switched off in G1-arrested populations by transferring cells to YEP containing 2% raffinose and α-factor. Cells were released to YPD containing benomyl to resume cell cycle and held in mitosis. Two different patterns of sister chromosome cohesion are shown: A budded cell with a single GFP dot represents functional sister chromosome cohesion; a budded cell with two GFP dots represents lack of sister chromosome cohesion. A single GFP dot is marked with a white arrow. At least 100 cells were imaged at each time point in each experiment. Three biological repeats were performed at each time point and for each strain; the right panel showed mean and standard deviation for the wild type (blue), Rec8-expressing (red), and scc1Δ (brown) strains. The scale bar is 5 μm. Data associated with this figure can be found in S1 Data. (D) The Rec8-expressing strain progressed through S phase faster and through mitosis slower. All strains were cultured as in Fig 1C, but cells were released in YPD to allow completion of the first cell cycle and entry into the second. Samples were collected at the indicated time points to examine DNA content by flow cytometry. Cell cycle profiles at 30 and 180 minutes are labeled in red and orange, respectively. For the cells expressing Scc1, cells are predominantly in S phase at 30 minutes, predominantly in G2 and mitosis from 45 to 75 minutes, and return to G1 at 90 minutes. Cells that express Rec8 have a long delay in mitosis, which is abolished by removing the spindle checkpoint. For examining the progression through mitosis, the timepoints from 75 to 180 minutes are highlighted by a square bracket on the y-axis. Chr.5-GFP, Chromosome 5-green fluorescent protein; GFP, green fluorescent protein; Rec8, recombination 8; Scc1, sister chromosome cohesion 1; Smc, structural maintenance complex; YEP, yeast extract and peptone; WT, wild type; YPD, yeast extract, peptone, and dextrose.

