Figure 1.

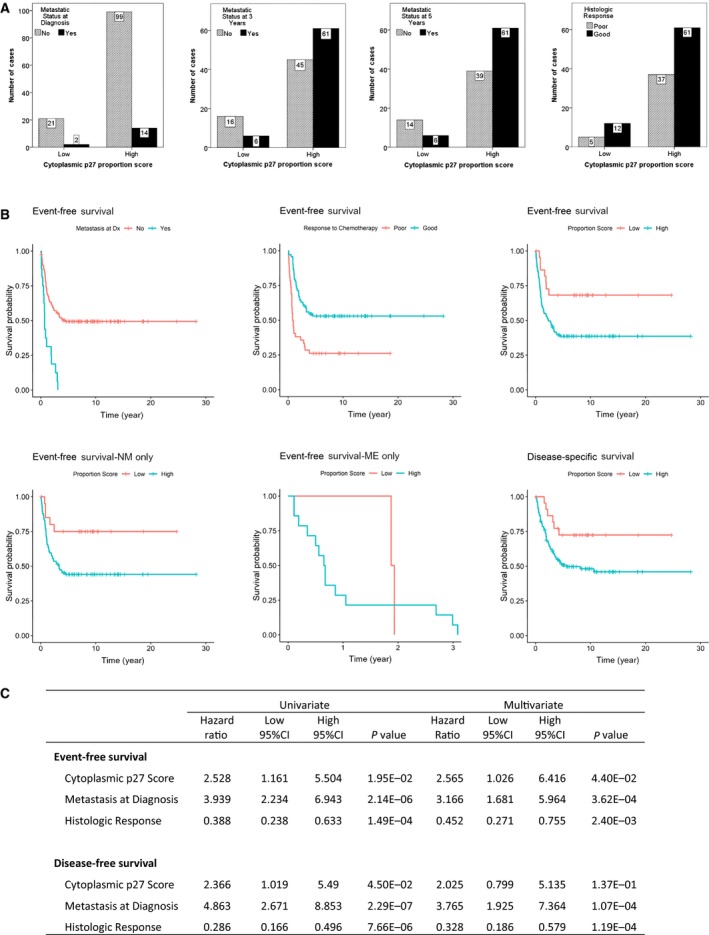
Correlation of clinical data with cytoplasmic p27 proportion scores in OS tissue microarray. (A) Bar graphs of the number of cases in different clinical categories by cytoplasmic p27 proportion score. Clinical categories from left to right are metastatic status at diagnosis, metastatic status at 3 years, metastatic status at 5 years, and histologic response to neoadjuvant chemotherapy. High cytoplasmic p27 score was significantly associated with development of metastatic disease within 3 years (P = 0.018) or 5 years (P = 0.014) of diagnosis. (B) Kaplan–Meier plots of EFS of OS patients. EFS was significantly associated with metastatic status at diagnosis (P = 2.14E‐06), histologic response (P = 1.49E‐04), and cytoplasmic p27 proportion score (P = 0.0195) (top left, middle and right). EFS of OS cases without metastasis at diagnosis (NM, P = 0.027, bottom left), but not in cases with metastasis at diagnosis (ME, P = 0.567, bottom middle), was significantly associated with cytoplasmic p27 score. DSS of OS cases was also significantly associated with cytoplasmic p27 proportion score (P = 0.045, bottom right). (C) Results of univariate and multivariate Cox proportional hazard model analyses for both EFS and DSS.
