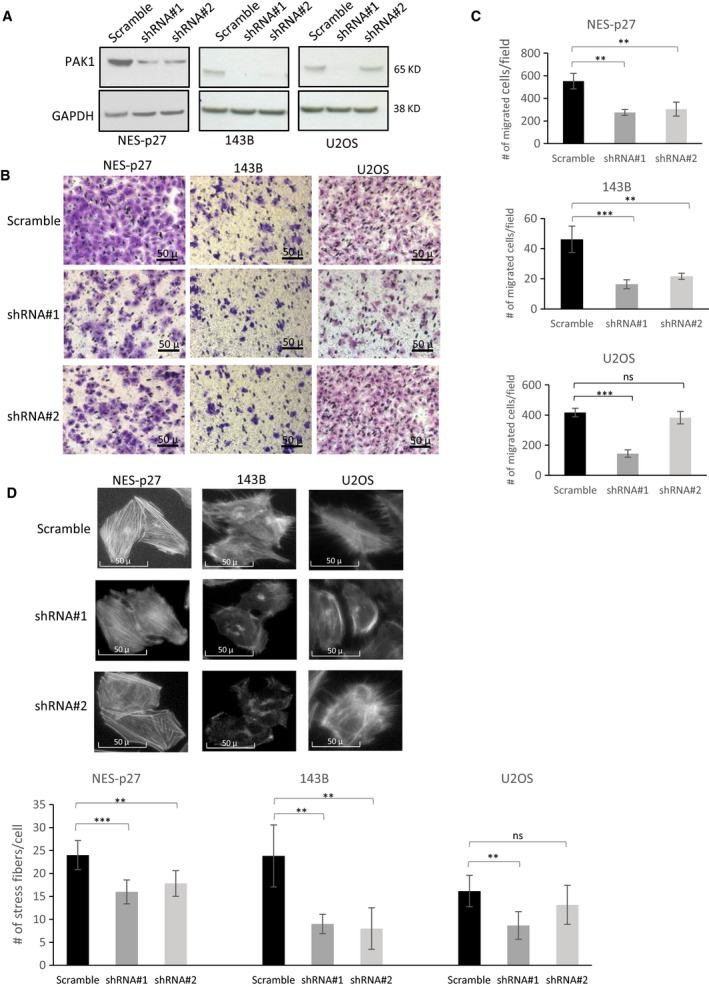
Figure 3.

Effects of PAK1 silencing on tumor cell migration and actin stress fiber formation in three distinct OS cell lines with p27 mislocalization. (A) Western blots of total PAK1 in PAK1‐shRNA (shRNA#1 and #2) mutants and scramble controls from NES‐p27, 143B, and U2OS cell lines. (B) Representative images of the transwell migration assays of the two PAK1‐shRNA mutants and the scramble controls in the three OS cell lines. (C) Quantification of the transwell migration assays shown in B. Migrated cells were stained, counted, and averaged using imagej software in five random and independent microscopic fields (10×). The experiment was replicated three times. (D) Representative images and quantification of phalloidin staining showing the amount and distribution of actin stress fibers in the two PAK1‐shRNA mutants and the scramble controls in the three OS cell lines (20×). In the quantification analyses, error bars and asterisks represent standard deviations and statistical significance (Student's t‐test; *P < 0.05; **P < 0.01; ***P < 0.001, ns, not significantly, respectively).
