
Figure 4.
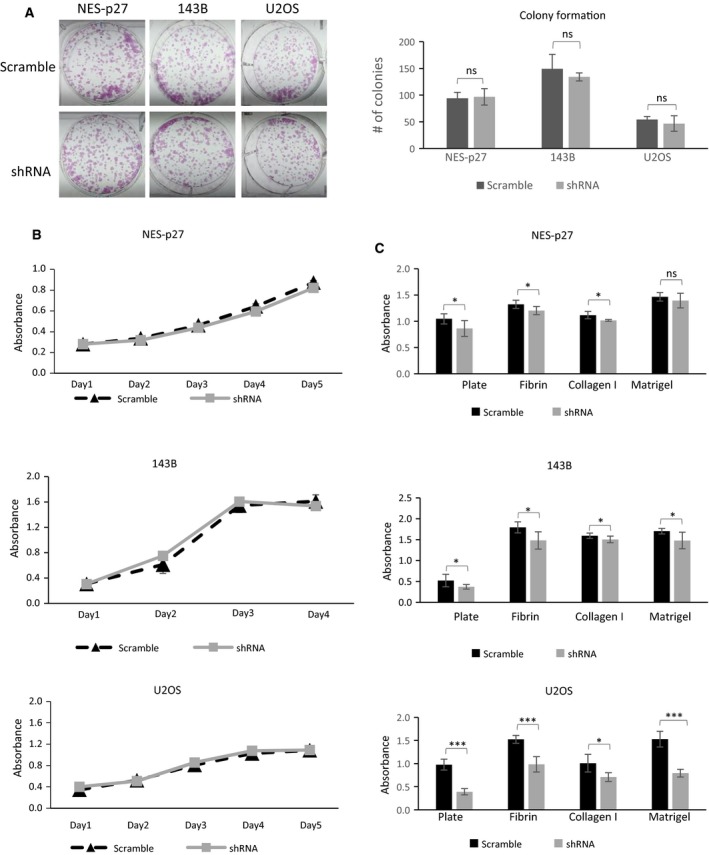
In vitro phenotypic analysis of PAK1‐shRNA#1 mutants derived from different OS cell lines. (A) Representative images and quantification of colony formation assays showing the tumorigenic potential of PAK1‐silenced mutants and scramble controls. (B) Growth curves of PAK1‐shRNA mutants and scramble controls. Five wells per cell were measured; error bars represent standard deviations of the replicates. Experiments were replicated three times. (C) Results of ECM adhesion assays to measure the adhesion abilities of PAK1‐shRNA mutants and scramble controls. The amounts of adhered cells were measured by A 560 nm, and replicates were averaged per cell line for each of the indicated ECM components or the empty plate without precoated ECM component. Error bars represent standard deviations of the replicates, and asterisks denote statistical significance (Student's t‐test; *P < 0.05; **P < 0.01; ***P < 0.001, ns, not significantly, respectively). All experiments were replicated three times.