
Figure 1.
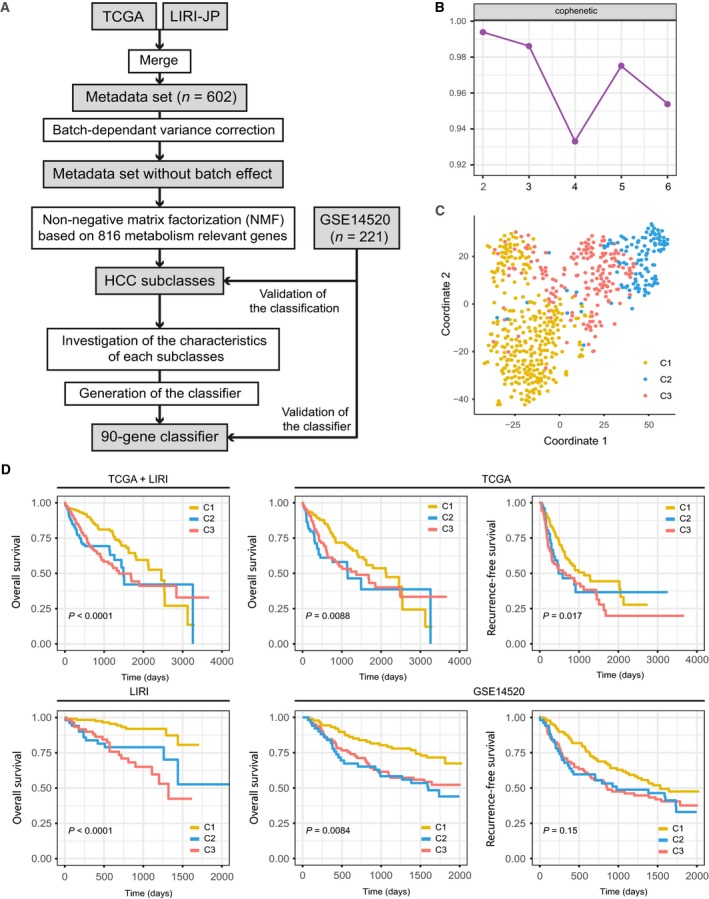
Identification of HCC subclasses using NMF consensus clustering in the metadata set. (A) Flow chart of the study. (B) NMF clustering using 816 metabolism‐associated genes. Cophenetic correlation coefficient for k = 2–5 is shown. (C) t‐SNE analysis supported the stratification into three HCC subclasses. (D). OS and RFS of three subclasses (C1, C2, and C3) in metadata set, independent TCGA or ICGC cohort, and http://www.ncbi.nlm.nih.gov/geo/query/acc.cgi?acc=GSE14520 cohort. The statistical significance of differences was determined by log‐rank test.