Figure 6.

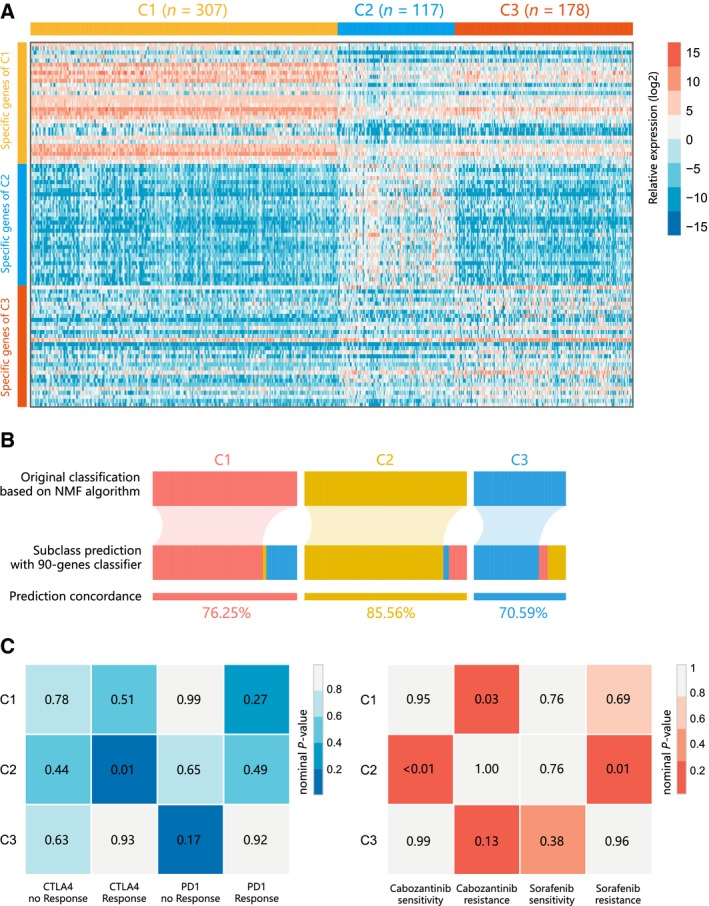
Identification of predictive classifier and putative targeted therapeutic and immunotherapeutic response. (A) Heatmap of the expression level of the 90‐gene classifier. (B) Concordance of HCC molecular subclass prediction between the 90‐gene classifier and original prediction based on NMF. (C) C2 may be more sensitive to the CTLA‐4 inhibitor (nominal P = 0.01) and cabozantinib (nominal P < 0.01) by SubMap analysis.
