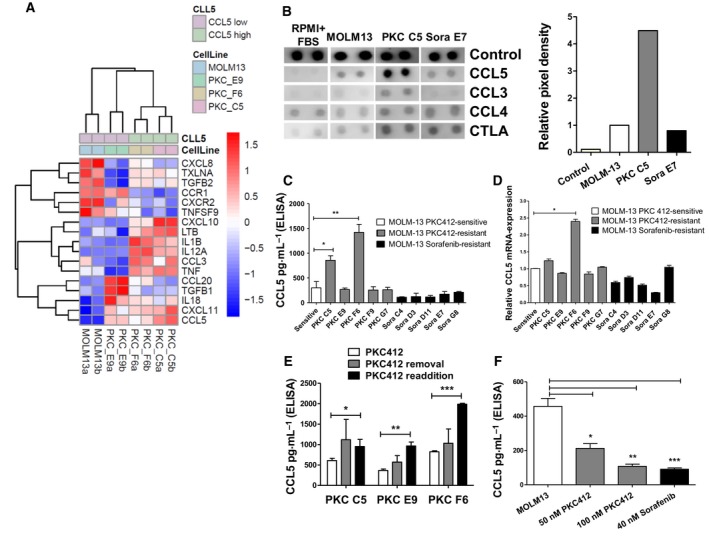
Figure 1.

High levels of CCL5 in the supernatant of PKC412‐resistant MOLM‐13 cells and increased expression of mRNA in PKC412‐resistant MOLM‐13 cell lines (A) Microarray results for cytokine/chemokine expression with RNA from three different PKC412 and MOLM‐13 sensitive cells. Color code represents the row‐wise z‐score intensity. N = 2. (B) Cytokine array of supernatant from one PKC412‐ (MOLM‐13 PKC C5) and one sorafenib‐resistant MOLM‐13 cell line (MOLM‐13 Sora E7). Medium supplemented with 20 % FBS and supernatant from sensitive MOLM‐13 cells served as controls. Supernatants were subjected to analysis 36 h after the addition of fresh culture medium. (C) CCL5 ELISA with supernatant from five PKC412‐ and five sorafenib‐resistant cell lines. Supernatants were subjected to analysis 36 h after the addition of fresh culture medium. (D) Quantitative reverse‐transcriptase PCR for CCL5 in TKI‐sensitive, PKC412‐resistant, and sorafenib‐resistant cell lines. Differences between data were compared by ANOVA. (E) CCL5 ELISA with cell supernatant from three different PKC412‐resistant cell lines after removal of and re‐exposure to PKC412. The supernatants were analyzed 36 h after removal of and 36 h after re‐exposure to PKC412. n = 3 (F) CCL5 ELISA with supernatant from sensitive MOLM‐13 cells that were cultured in the presence of PKC412 at 50 or 100 nm or 40 nm sorafenib. Cell culture supernatants were analyzed 36 h after the addition of fresh culture medium containing the FLT3 inhibitors. Significant differences are marked with (*): *P < 0.05, **P < 0.01, ***P < 0.001. If not otherwise stated: Student’s t‐test. Error bars represent SD. N = 3 for (C–F).
