Figure 3.

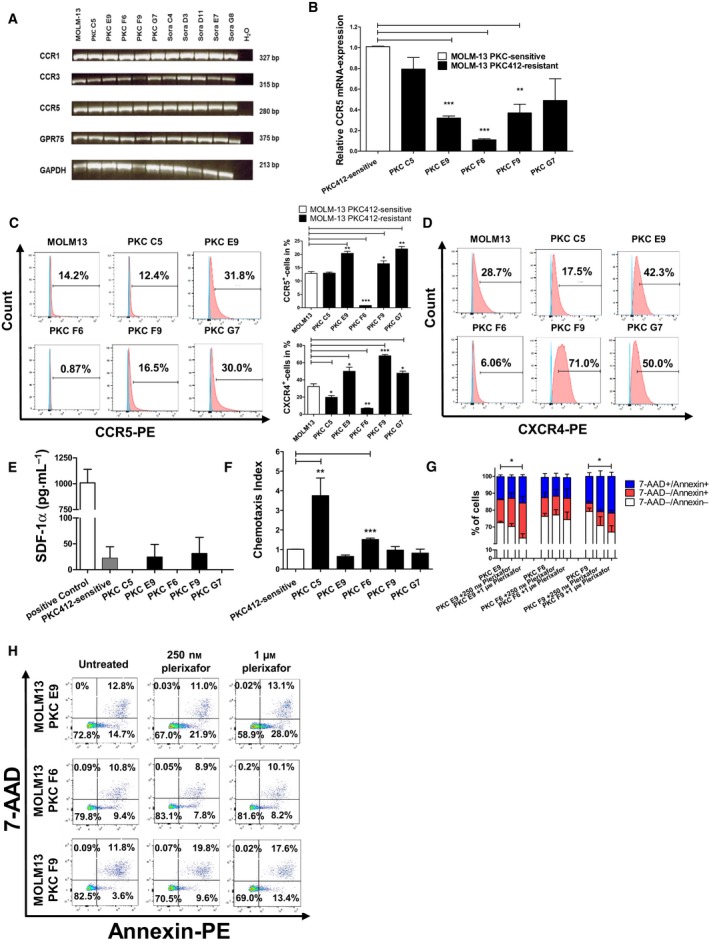
Analysis of CCR1, CCR3, CCR5, and GPR75 expression on sensitive and resistant MOLM‐13 cells and plerixafor treatment (A) Results of reverse‐transcriptase PCR for CCR1, CCR3, CCR5, and GPR75 for mRNA/cDNA isolated from PKC412‐sensitive and PKC412‐resistant MOLM‐13 cells. PCR products were separated each on one gel (merged data). (B) Quantitative real‐time PCR for the main‐CCL5 receptor CCR5 for mRNA/cDNA isolated from sensitive and PKC412‐resistant MOLM‐13 cell lines. (C) Flow cytometric analysis for CCR5 surface expression on PKC412‐sensitive and PKC412‐resistant MOLM‐13 cell lines was conducted with a PE‐coupled antibody against CCR5. Unstained control cells that were used as control are shown in blue and PE‐positive cells are depicted in red. (D) Flow cytometric analysis for CXCR4 on sensitive and PKC412‐ and sorafenib‐resistant MOLM‐13 cell lines was performed with a PE‐coupled antibody against CXCR4. Unstained control cells that were used as controls are shown in blue and PE‐positive cells are depicted in red. (C) + (D) middle: Statistical analyses of flow cytometric CCR5 and CXCR4 stainings. (E) SDF‐1α‐ELISA. Cell culture supernatants from sensitive and PKC412‐resistant MOLM‐13 cells were analyzed 36 h after the addition of fresh culture medium. (F) Chemotaxis of sensitive MOLM‐13 cells against supernatants of PKC412‐resistant MOLM‐13 cells. Cell culture supernatants were collected 36 h after addition of fresh culture medium and added to the lower panel of a chemotaxis chamber. Then, PKC412‐sensitive Molm‐13 cells were added for 2 h to the upper chamber and chemotaxis was measured via flow cytometry. (G) + (H): Three PKC412‐resistant cell lines (PKC E9, F6 and F9) were cultured for 36 h with PKC412 plus either 250 nm or 1 μm plerixafor. Then, the cells were analyzed for vital (Annexin‐PE‐, 7‐AAD) and apoptotic cells (Annexin‐PE+, 7‐AAD+) via flow cytometry. (G) Same experiments as in (H), depicted as bar chart. Significant differences are marked with (*): *P < 0.05, **P < 0.01, ***P < 0.001. Student’s t‐test. Error bars represent SD. N = 3 for (B–G).
