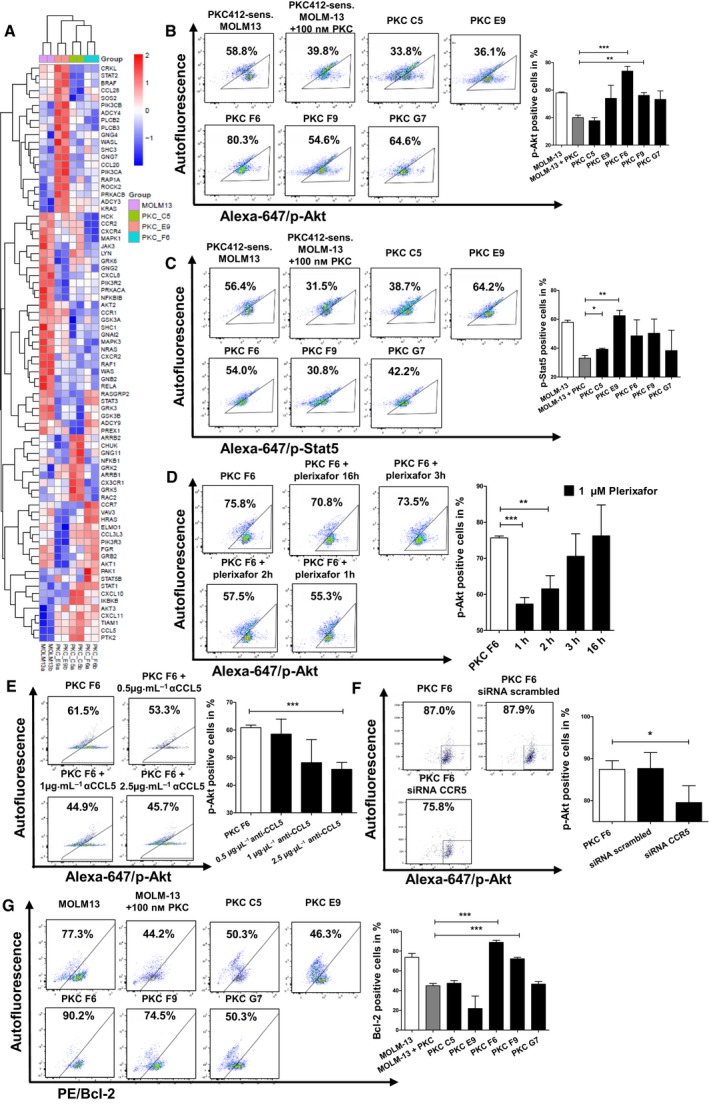
Figure 4.

Microarray analysis for differences in mRNA expression between PKC412‐sensitive and PKC412‐resistant cell lines and analysis of p‐Akt, p‐Stat5, and Bcl2 upon plerixafor treatment, anti‐CCL5 inhibitory antibody, or siRNA (A) Selected genes are regulated in at least one of the three PKC412‐resistant cell lines against PKC412‐sensitive MOLM‐13 (adjusted P‐value < 0.05) and belong to the KEGG chemokine pathway. Color code represents the row‐wise z‐score intensity. N = 2 (B) + (C) PKC412‐sensitive and PKC412‐resistant MOLM13 cells were serum‐starved for 12‐h and incubated without or with 100 nm PKC412. After incubation, cells were analyzed via intracellular flow cytometric analysis for (B) p‐Akt or (C) p‐Stat5. (D) The PKC412‐resistant cell line PKC F6 was serum‐starved for 12‐h, while still under cultivation of 100 nm PKC412. Then, plerixafor (1 µm) was added for 1, 2, 3, or 16 h followed by flow cytometric analysis of intracellular p‐Akt levels. (E) The PKC412‐resistant cell line PKC F6 was serum‐starved for 12 h, while still under cultivation of 100 nm PKC412. Then, αCCL5 at the indicated concentrations was added for 1 h followed by flow cytometric analysis of intracellular p‐Akt levels. (F) PKC412‐resistant cells were serum‐starved for 16 h and transfected with 20 nm of siRNA against CCR5 or control siRNA against scrambled. After 5 h, cells were analyzed via intracellular flow cytometry for p‐Akt levels. (G) PKC412‐sensitive and PKC412‐resistant MOLM13 cell lines were serum‐starved for 12 h and incubated without or with 100 nm PKC412. After incubation, cells were analyzed via intracellular flow cytometric analysis for Bcl‐2. Significant differences are marked with (*): *P < 0.05, **P < 0.01, ***P < 0.001. Student’s t‐test. Error bars represent SD. N = 3 for (B–G).
