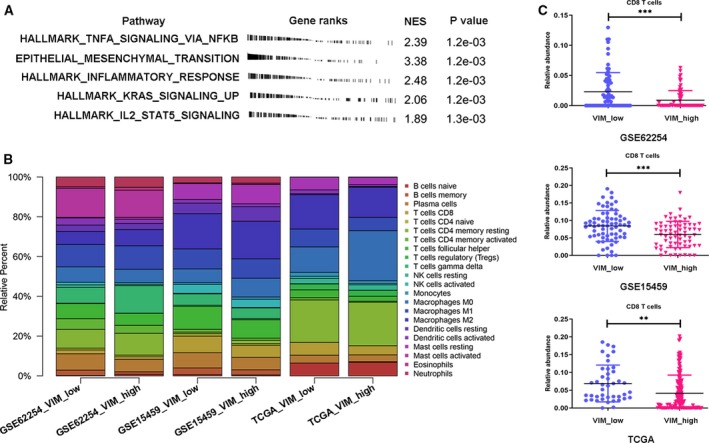
Figure 2.

The functional analysis and immune cell fraction with VIM expression across GC patients. (A) GSEA analysis of high expression of VIM‐related genes using the hallmark gene set. The top five most‐enriched pathways are shown. (B) CIBERSORT immune cell fractions were determined for high expression of VIM‐related GC patients in http://www.ncbi.nlm.nih.gov/geo/query/acc.cgi?acc=GSE62254, http://www.ncbi.nlm.nih.gov/geo/query/acc.cgi?acc=GSE15459, and TCGA databases. (C) Mean values and standard deviations for CD8 cells were calculated for low‐ and high‐VIM expression. **P < 0.01; ***P < 0.001.
