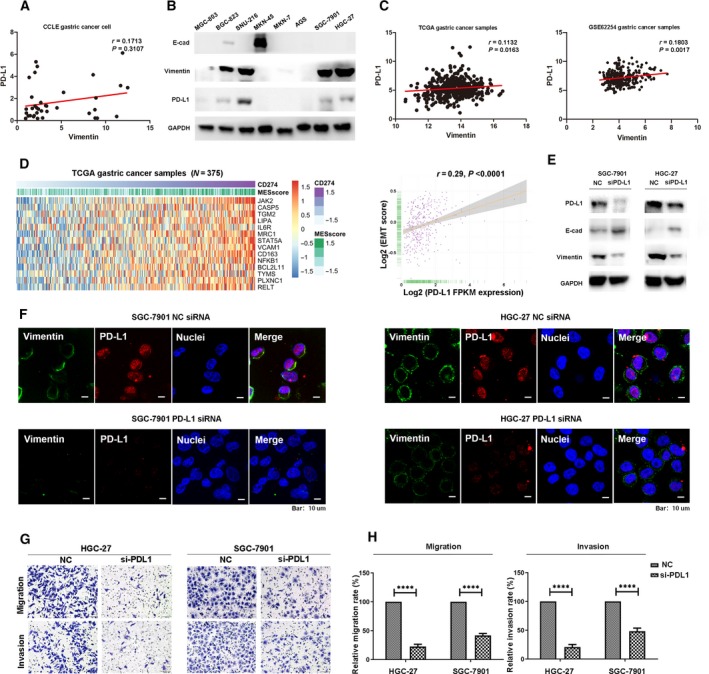
Figure 3.

PD‐L1 promoted EMT process, migratory, and invasive capacities of GC cells. (A) Correlation between PD‐L1 and VIM mRNA expression in 37 GC cell lines of the Cancer Cell Line Encyclopedia database. (B) Western blot analysis of PD‐L1 expression and EMT markers in eight GC cell lines. (C) Correlation between PD‐L1 and VIM mRNA expression in GC patients analyzed by TCGA and http://www.ncbi.nlm.nih.gov/geo/query/acc.cgi?acc=GSE62254 databases. (D) The EMT‐related signatures enriched by high PDL1 expression in the GSVA based on TCGA GC database (left) and comparison of PD‐L1 expression with EMT score (right). (E) Western blot analysis of PD‐L1 expression and EMT markers in HGC‐27 and SGC‐7901 cells transfected with PD‐L1 siRNA or negative control siRNA (NC). (F) Immunofluorescent staining of VIM in HGC‐27 and SGC‐7901 cells transfected with PD‐L1 siRNA or negative control siRNA (NC), VIM (green), PD‐L1 (red), and nuclear stain (blue). Scale bar, 10 μm. (G) Effect of PD‐L1 knockdown on migratory and invasive capacities (magnification 20 × 10) in HGC‐27 and SGC‐7901 cells. (H) Histograms of the numbers of migrated and invaded cells. Five random fields were selected for statistical analysis. All the data are shown as mean ± SD of three independent experiments. ****P < 0.0001.
