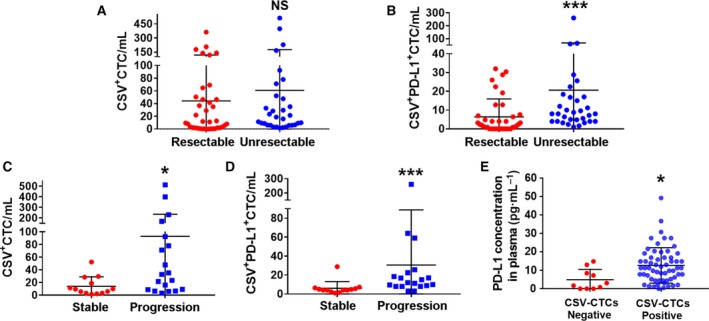
Figure 6.

Comparison of CTCs numbers obtained from CSV isolation method grouped by patients’ disease status and therapeutic response. Comparison of total CTC counts (A) and PD‐L1+CTC counts (B) in patients with resectable GC or unresectable GC disease. Comparison of total CTC counts (C) and PD‐L1+CTC counts (D) in advanced GC patients with stable or progression disease. (E) Comparison of PD‐L1 concentration in patients with positive or negative CTCs. NS, not significant; *P < 0.05, ***P < 0.001.
