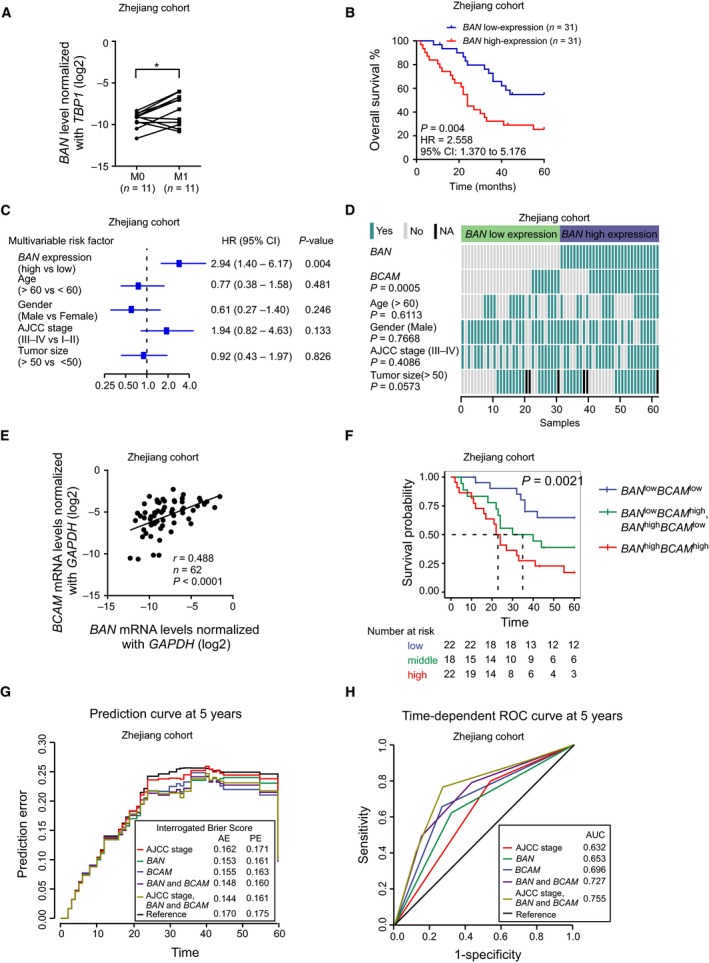
Figure 7.

BAN upregulation is associated with GC metastasis and poor prognosis. (A) The relative expression of BAN expression in 11 GC tissues with distant metastasis (M1) compared to age‐ and sex‐matched GC tissues without metastasis (M0) in the Zhejiang cohort. (B) Kaplan–Meier survival curve analysis between patients with BAN‐high expression group and BAN‐low expression in the Zhejiang cohort. The GC patients were classified into BAN‐high or BAN‐low expression groups according to the median value. P = 0.004, HR = 2.558, 95% CI: 1.370–5.176. (C) The forest plot depicted the multivariable Cox analysis results of BAN in the Zhejiang cohort. All the bars correspond to 95% confidence intervals. (D) The heatmap illustrated the association of BAN expression, BCAM expression, and different clinical characteristics in the Zhejiang cohort. The GC patients were classified into BAN‐high and BAN‐low expression groups according to the median value. Statistical significance was performed by the χ2 test. (E) The correlation of BCAM mRNA and BAN expression levels in GC tissues was analyzed by qRT‐PCR. r = 0.488, n = 62, P < 0.0001. (F) Kaplan–Meier survival curve analysis between low (BCAM‐low and BAN‐low expression group, n = 22), middle (BCAM‐high and BAN‐low expression, or BCAM‐low and BAN‐high expression group, n = 18) and high (BCAM‐high and BAN‐high expression group, n = 22) groups in the Zhejiang cohort. The GC patients were classified into low, middle, and high groups according to the median value of BCAM and BAN. Number at risk table for BCAM and BAN expression can also be seen below the plot; P value was calculated using the log‐rank test. (G) PE curves of the different predictors in the Zhejiang cohort. Apparent error and 10‐fold cross‐validated cumulative PE at 5 years were computed using Kaplan–Meier estimation as reference. (H) Time‐dependent ROC curve analysis at 5 years of different predictors in the Zhejiang cohort.
