
Figure 4.
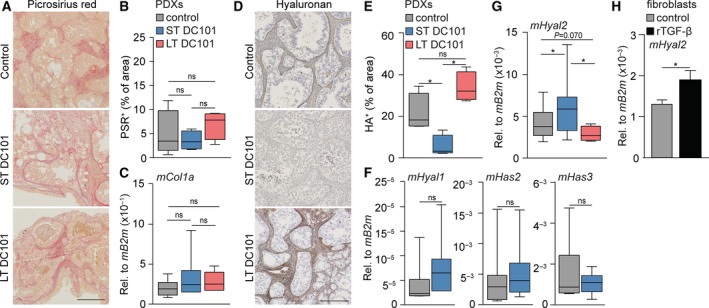
Activated CAFs degrade the ECM via expression of hyaluronidase‐2. (A) PDX tumors were histochemically stained for collagens with picrosirius red (PSR). Scale bar is 500 µm. (B) Quantification of PSR as percentage of area using ImageJ software. n = 9 for control group and n = 4 for LT and ST DC101 groups. (C) mRNA expression of stromal mCol1a was determined in PDX tumors using qPCR. n = 20 for control group and n = 10 for LT and ST DC101 groups. (D) PDX tumors were stained for hyaluronan (HA) with IHC. Scale bar is 250 µm. (E) Quantification of HA as percentage of area using imagej software. n = 5 for control group and n = 4 for LT and ST DC101 groups. (F) As for panel C, assessing stromal mHyal1, mHas2, and mHas3. n = 10 per group. (G) As for panel C, assessing stromal mHyal2. n = 20 for control group and n = 10 for LT and ST DC101 groups. (H) mRNA expression of mHyal2 was determined in CAFs that were treated with rTGF‐β for 24 h or left untreated using qPCR. n = 3. Error bars in all bar graphs represent SD. All Student’s t‐test. *P < 0.05.