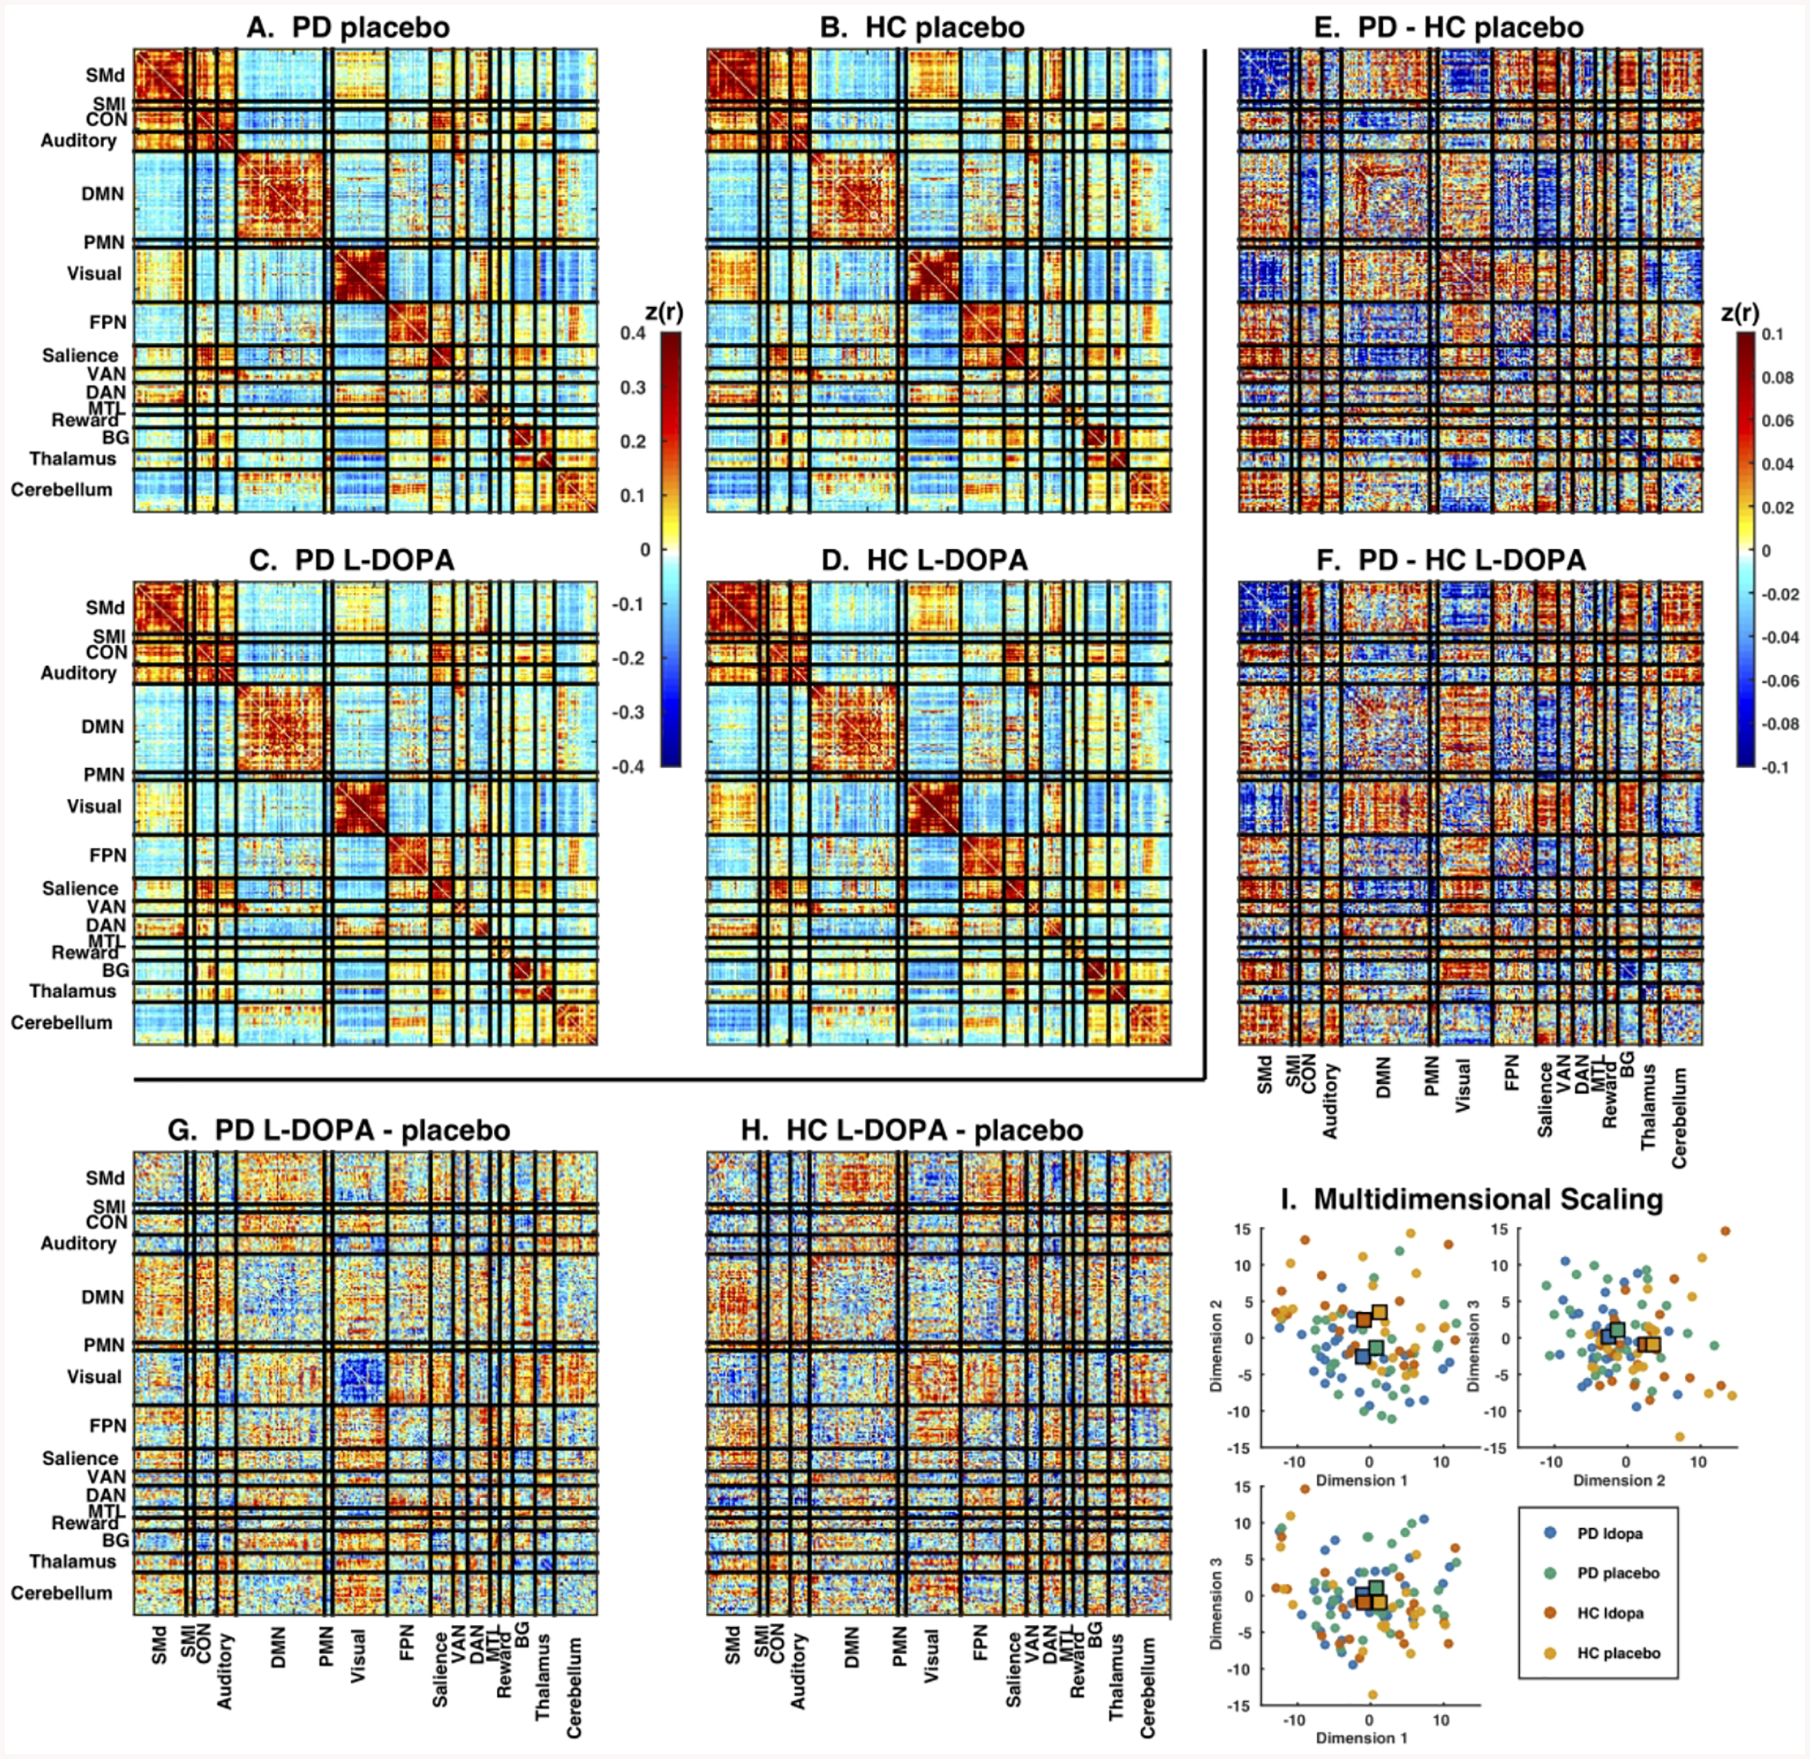
Figure 1.

Large-scale networks in Parkinson disease and controls after L-DOPA or placebo. Mean correlation matrices in (A) PD placebo, (B) HC placebo, (C) PD L-DOPA and (D) HC L-DOPA conditions. All conditions showed strong network organization with well-defined block structure. Note generally strong positive correlations within each network (diagonal) and mixture of weaker positive and negative correlations between networks (off-diagonals). Direct comparison between groups (PD – HC) for the (E) L-DOPA and (F) placebo conditions, and between drug conditions (L-DOPA – placebo) for the (G) PD and (H) HC groups. There was a mixture of positive and negative differences. Note much larger differences between groups than between drug conditions. Color scales indicates magnitude of Z-transformed Pearson’s correlations (note different color scales for mean and difference matrices). (I) Each plot shows the relative positions of individual participants FC matrices in the first 3 dimensions from multi-dimensional scaling. Conditions are indicated by color: PD L-DOPA (blue), PD placebo (green), HC L-DOPA (red), and HC placebo (orange). Large squares represent the central tendency of each group. Note separation between PD and HC conditions, as well as lack of centroid shift with L-DOPA treatment.
