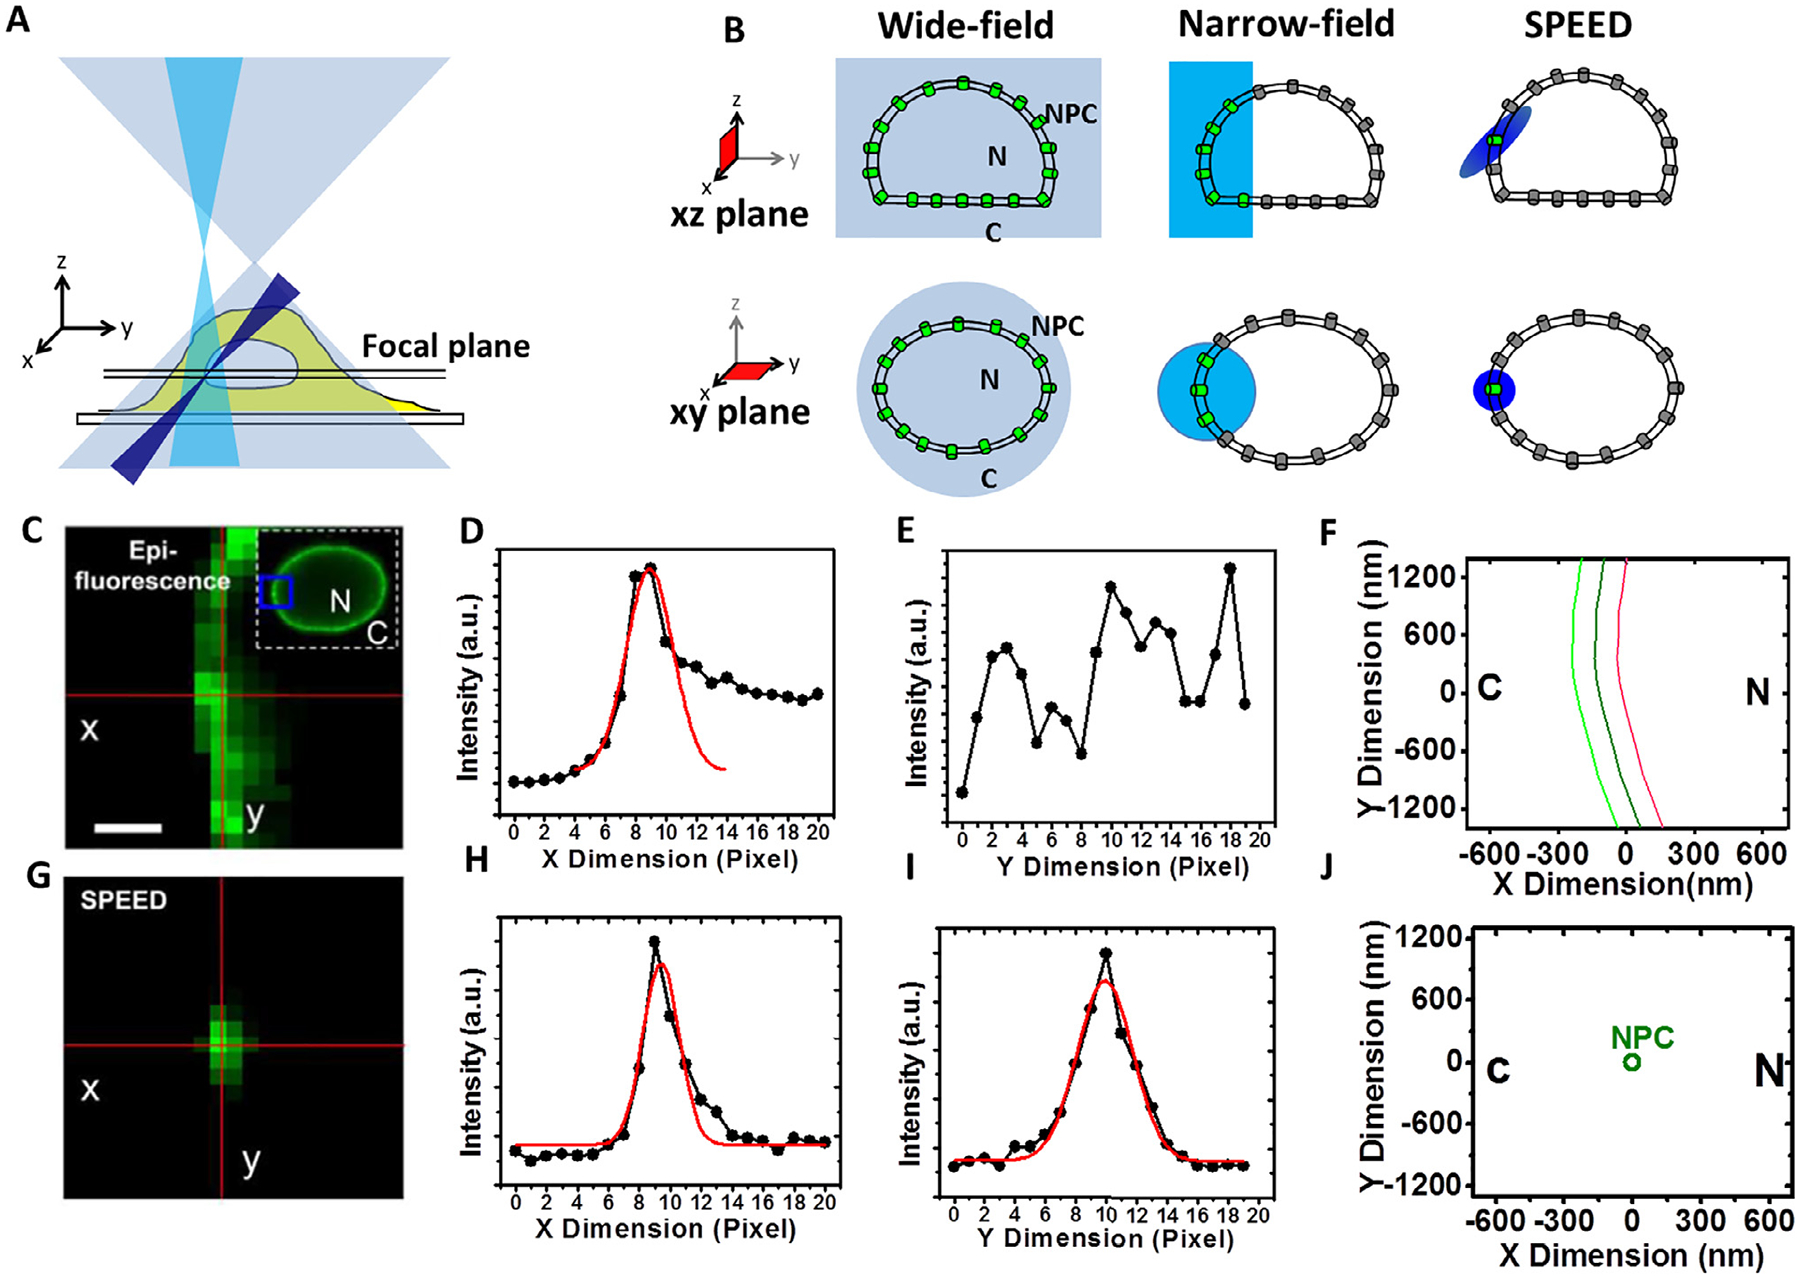
Fig. 1.

Illuminations of various single-molecule microscopy techniques. (A and B) Simplified optical diagrams illustrate the different excitation beam paths and the illumination volumes of the wide-field (light blue), narrow-field (cyan) epi-fluorescence microscopy and SPEED (blue) microscopy. GFP-labeled NPCs embedded in NE were highlighted inside (green) and outside (gray) the microscopy illumination volumes in the xy and xz planes [54]. (C) Overlapped fluorescence of GFP-NPCs on the NE under the illumination of wide-field or narrow field epi-fluorescence microscopy. The selected area is enclosed by a blue box in the image of the entire fluorescent NE. Scale bar, 1 μm. (D and E) The line-scan intensities for the pixels (red lines) in the epi-fluorescence image (C) are plotted in the x dimension (D) and y dimension (E). For the x dimension, a 2D line-scanning fitting is performed across the intensities (D). (F) The dark-green curve shows the determined position of the middle plane of the NE. The light-green and red curves are for reference at −100 nm and +100 nm from the middle plane of the NE, respectively. (G) Only a single GFP-NPC was excited in the illumination volume of the SPEED microscopy. (H and I) The peak position of the 2D line-scanning fitting for a GFP-NPC fluorescent spot in (G). (J) The 2D centroid of the single NPC determined by 2D Gaussian fitting. N, nucleus; C, cytoplasm. Figures were adapted from our previous publications with permissions [40].
