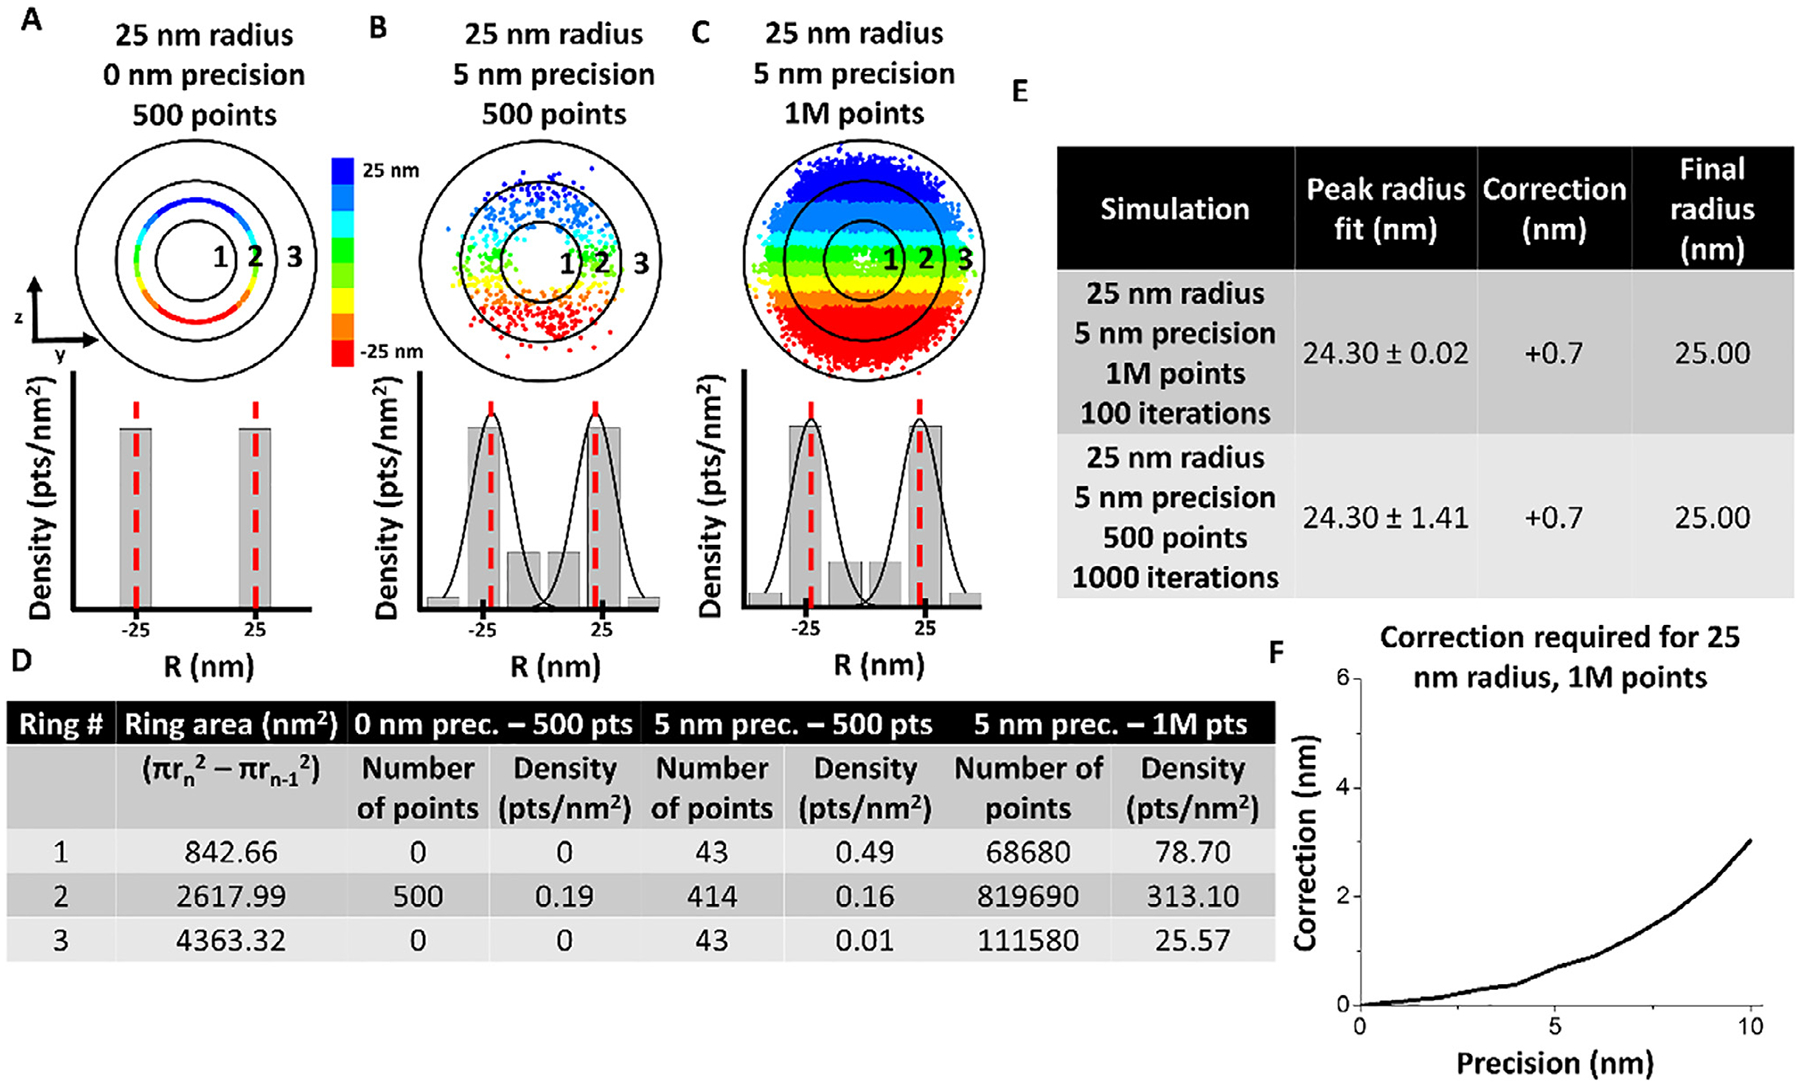
Fig. 12.

Sensitivity of inner bins necessitates slight correction of peak position during simulation. (A)–(C) Simulated single molecule data and corresponding 3D density histogram for simulation with 25 nm radius, 0 nm localization error, and 500 points. Red dashed lines indicate mean peak fitting. (B) Simulated single molecule data and corresponding 3D density histogram for simulation with 25 nm radius, 5 nm localization error, and 500 points. Red dashed lines indicate mean peak fitting. (C) Simulated single molecule data and corresponding 3D density histogram for simulation with 25 nm radius, 5 nm localization error, and 1 million points. Red dashed lines indicate mean peak fitting. (D) Table showing the calculation to obtain each bin of the 3D density histogram. (E) Table showing that even one million points does reconstruct a precise 25 nm peak fitting due to the fact that the inner radial bins have smaller area and are slightly more sensitive to changes in density. (F) Correction required for each precision up to 10 nm for a 25 nm radius. This correction process was performed before each simulation to accurately localize the RM density peak and correlate it to the ideal RI from which the data was simulated.
