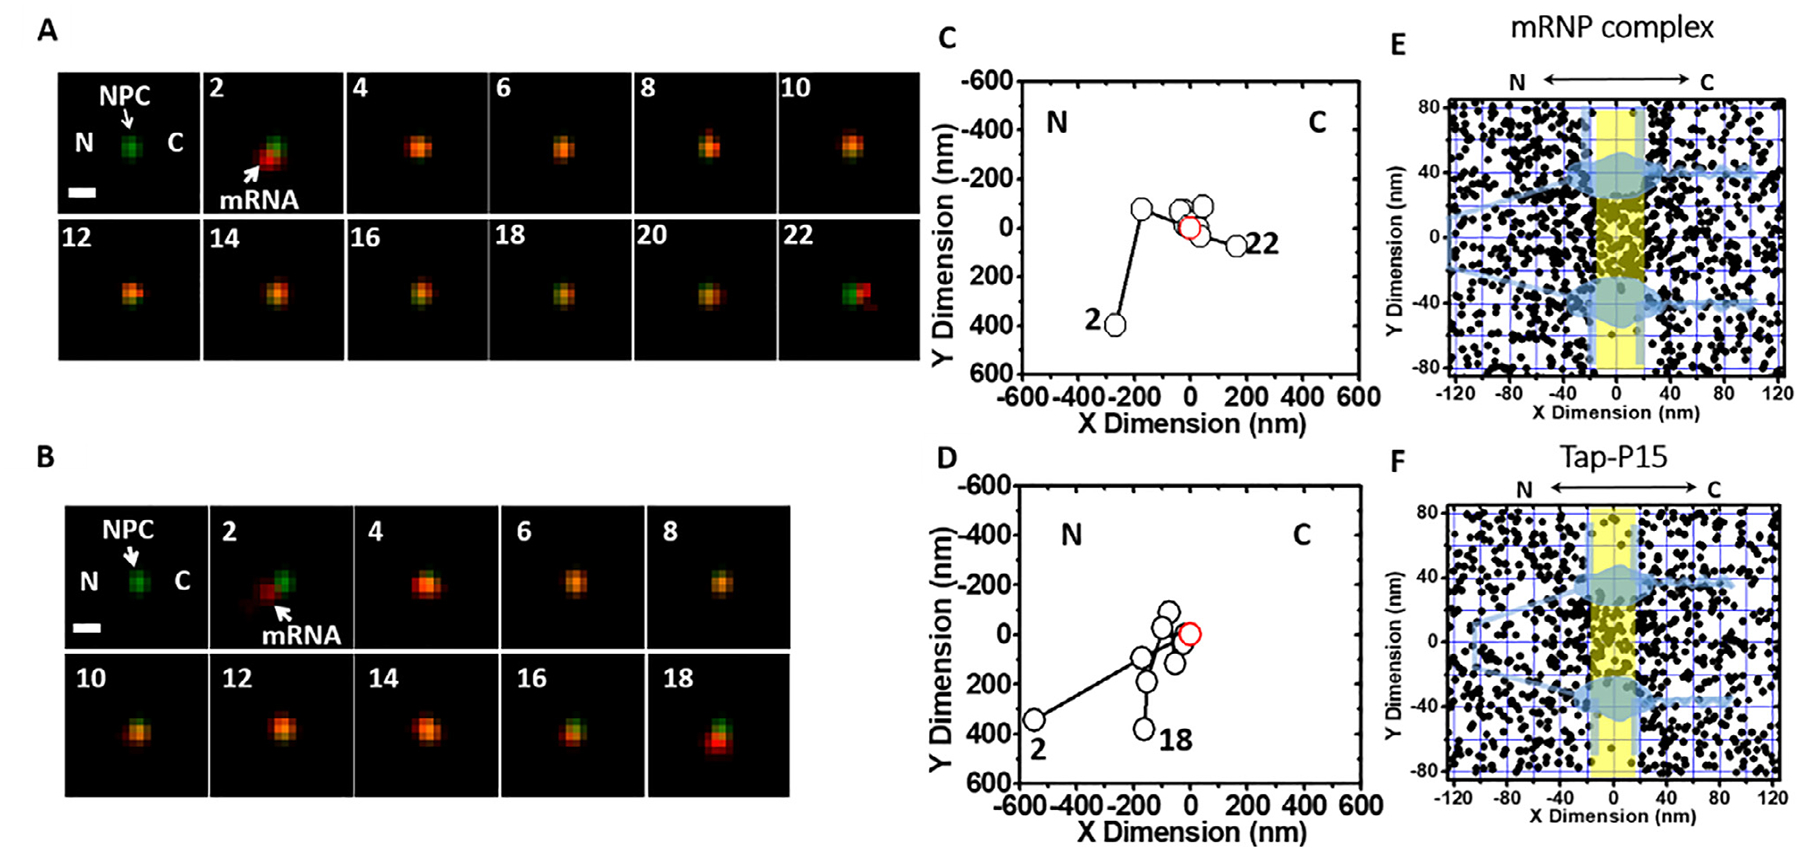
Fig. 7.

Single-molecule trajectories and 2D spatial locations of mRNPs in single NPCs [40]. (A) A typical successful single mRNP export event captured by SPEED microscopy. A single mCherry-tagged mRNP (red spot) started from the nucleus, interacted with a single GFP-tagged NPC (green spot) and arrived in the cytoplasm. Numbers denote time in milliseconds. (B) A typical abortive single mRNP export event. A single mCherry-tagged mRNP (red spot) started from nucleus, interacted with a single GFP-tagged NPC (green spot) and returned to the nucleus. (C and D) Single-particle tracks (black open dots) and the centroid of the NPC (red open dot) were acquired by 2D Gaussian fitting to point spread functions in a series of images for either the successful event in A or the abortive event in B. (E) Experimentally determined 2D spatial locations of mRNPs in the NPC. A schematic of the NPC (light blue) is superimposed, and the central region of the NPC (−20 nm to 20 nm) is highlighted in yellow. (F) Experimentally determined 2D spatial locations of Tap/p15 in the NPC. A schematic of the NPC (light blue) is superimposed, and the central region of the NPC (−20 nm to 20 nm) is highlighted in yellow. C, cytoplasmic side of the NPC; N, nucleoplasmic side of the NPC.
