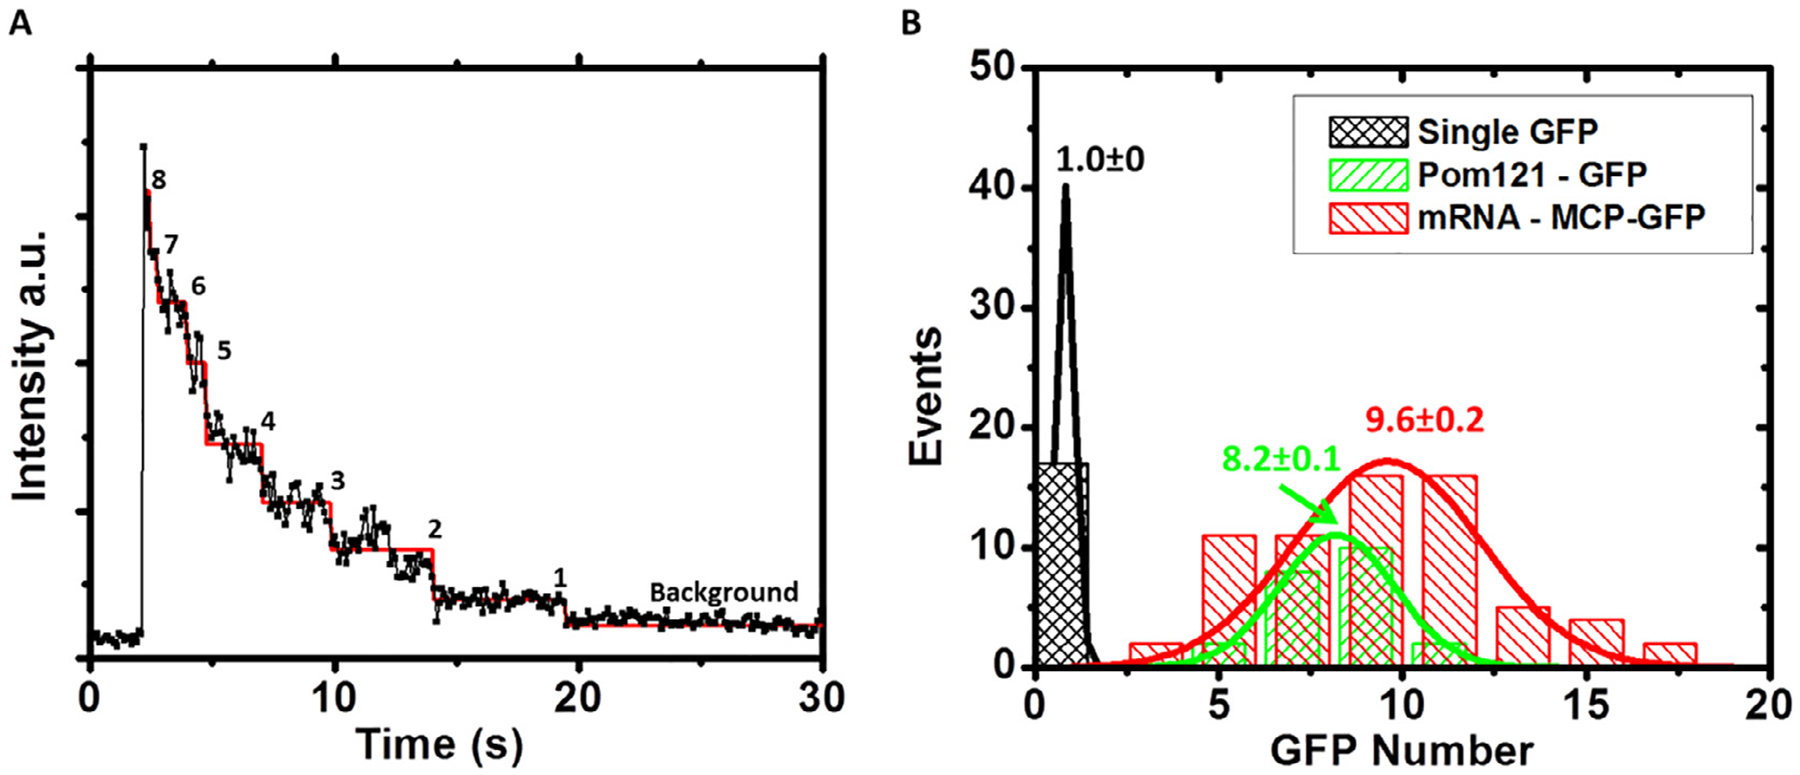
Fig. 8.

Determination of intensity of single GFPs, copy number of GFP-POM121 per NPC and copy number of MCP-GFP per mRNP in live cells [40]. (A) Photobleaching curve of eight copies of GFP-POM121 in a single NPC. The steps were determined by the maximum likelihood ratio method [61,62]. The intensity of single GFP was determined by averaging the step-intensity of GFP-POM121 in the NPC of live cells. (B) Compared to the fluorescence intensities of single GFP, ~8 copies of GFP-POM121 were found in each NPC and ~10 copies of MCP-GFP per mRNP. MCP-mCherry-mRNA was constructed with the exact same procedure as MCP-GFP-mRNA, and thus ~10 copies of MCP-mCherry per mRNA were concluded.
