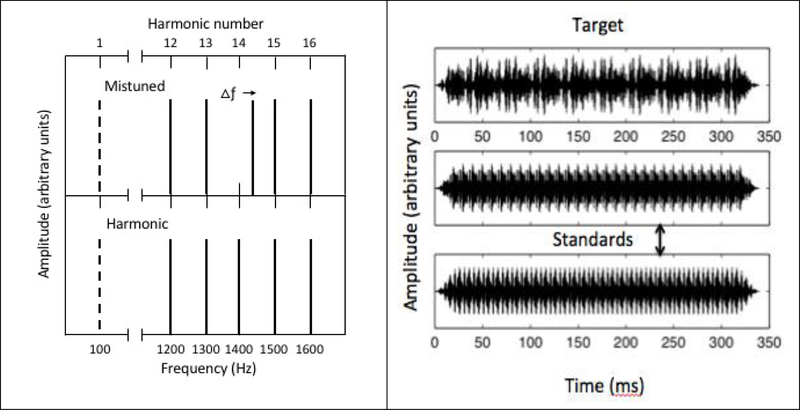
Figure 2.
Stimulus example. Left Panel—Top: Schematic of the stimulus spectrum for target in which the 14th harmonic has been upshifted in frequency. The missing F0 is shown as a dashed line. Bottom: Stimulus spectrum for the standard complex showing harmonics 12–16 of 100 Hz. Right Panel—Example time waveforms of the target stimulus and two standard foils for the 340 ms, 100-Hz F0 condition.

