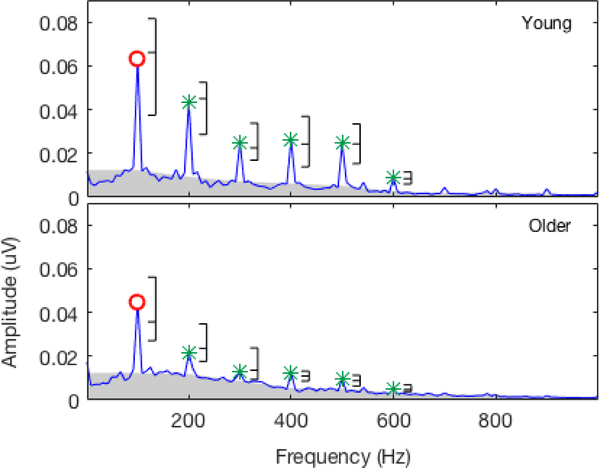
Figure 4.
Grand mean magnitude spectra for the sABR response to the steady-state segment (60–180 ms) for younger (top panel) and older (bottom panel) adults. The open circles mark the F0, and the asterisks mark the expected harmonic components. Brackets beside each component display the distribution of the data in which the bottom and top dashes indicate the 25th and 75th percentiles, respectively, and the middle dash indicates the median. The gray shading provides an illustration of the noise floor and is extrapolated from the point estimates of noise used to analyze the noise floor.

