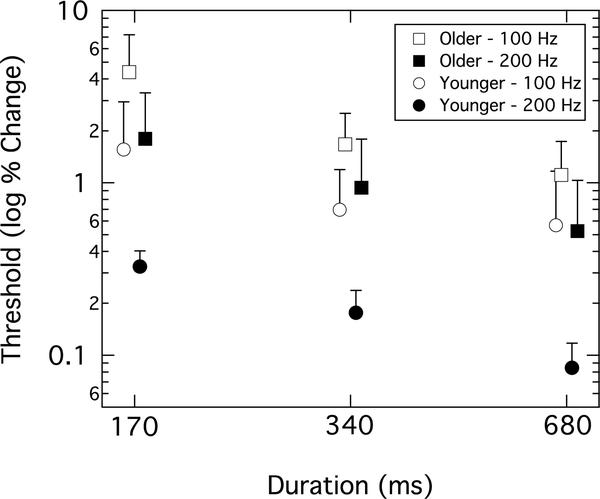
Figure 5.
Group mean thresholds for detection of the mistuned harmonic. Response reported as log percent change in the shifted component. Results are shown for younger (circles) and older (squares) adults. Thresholds were collected at two F0s—100 Hz (open symbol) and 200 Hz (filled symbol)—and three different durations, indicated on the abscissa. Error bars represent +1 standard deviation. Symbols are offset for better visualization.

