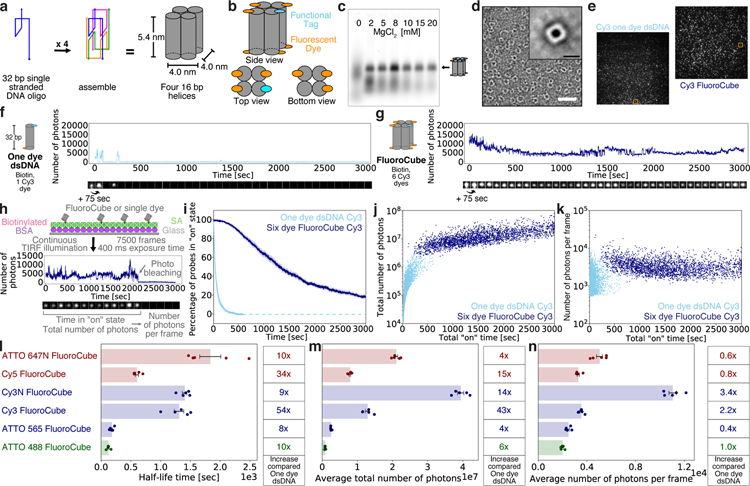
Figure 1 |. Design, assembly, and photophysical properties of DNA FluoroCubes.
(a) Design and shape of DNA FluoroCubes. Four 32 bp long single-stranded DNAs (ssDNA) are connected using crossovers resulting in four connected 16 bp long double-stranded DNAs (dsDNA) with a size of approximately 5.4 x 4.0 x 4.0 nm. A detailed map of oligonucleotide routing and the bases is depicted in Supplementary Figure 1 b. (b) Each of the 5’ and 3’ ends of the DNA can be functionalized. For the DNA FluoroCube design we used six fluorophores and one functional tag such as HALO-ligand, benzylguanine for SNAP tag, thiol, biotin, or amine. (c) 3.0% agarose gel of DNA FluoroCubes after thermal annealing. The four ssDNA strands are annealed with different MgCl2 concentrations. Quantification of assembly yield is shown in Supplementary Figure 1 c. Note, that the different brightness of FluoroCube bands is mainly due to variation of material loaded into the gel. Here the ssDNAs were modified with six ATTO 647N dyes and one biotin. (d) Negative stain electron microscopy image of DNA FluoroCubes. Insert shows class average of 983 particles. More images are shown in Supplementary Figure 1 e and 2. Here the FluoroCube was labeled with six ATTO 647N dyes and one biotin. White scale bar: 30 nm. Black scale bar: 6 nm. Class averaging was performed once. (e) Example TIRF image of a biotin functionalized six Cy3 dye FluoroCube and a 32 bp long double-stranded DNA (dsDNA) with one Cy3 dye. Orange boxes show molecules whose intensity traces are shown in f (one dye dsDNA) and g (FluoroCube). (f, g) Example intensity trace of (f) Cy3 one dye dsDNA and (g) six Cy3 dye FluoroCube with one biotin. More intensity traces with different fluorophores are shown in Supplementary Figure 4. (h) Experimental setup for quantification of photophysical properties of six dye FluoroCubes and one dye dsDNA. Biotinylated samples are attached to a cover slip (Glass) with biotinylated BSA, and streptavidin (SA). Then movies with 7,500 frames total (or until all probes photobleached) and 400 ms exposure each are recorded under continuous laser illumination. Intensity traces of single-molecules are analysed for time in “on” state (half-life), total number of photons, and number of photons per frame. A detailed description of the analysis can be found in Online Methods. (i) Photostability of six Cy3 dye FluoroCubes and Cy3 one dye dsDNA. The survival rate was quantified by counting the percentage of probes in the “on” state at any given time from 0 to 3,000 seconds. Opaque color is the standard error of the mean of five or four repeats (six dye FluoroCubes or one dye dsDNA, respectively) with more than 500 molecules each. Once all probes photobleached data analysis was terminated. This is indicated by the dashed line. (j) Total number of photons of six Cy3 dye FluoroCubes and Cy3 one dye dsDNA as a function of the total “on” time at the single-molecule level (pooled from all experiments). (k) Average number of photons per frame of six Cy3 dye FluoroCubes and Cy3 one dye dsDNA as a function of the total “on” time at the single-molecule level (pooled from all experiments). (l-n) Bar plot of the (l) half-life time, (m) average of the total number of photons, and (n) average number of photons per frame of six dye DNA FluoroCubes with different fluorophores. The error bars show the standard error of the mean of five repeats with more than 100 molecules each. Dots show the values of individual experiments. The tables on the right show fold increase of six dye DNA FluoroCubes compared to one dye dsDNA. Single-molecule distributions are shown in Supplementary Figure 7. Note, that the average of the total number of photons will be slightly higher for some six dye FluoroCubes than shown here because not all probes bleached within 3,000 seconds. (i-n) Each experiment was repeated five or four times with freshly assembled six dye FluoroCubes or one dye dsDNA, respectively. For every experiment we prepared new microscope slides. Exact numbers (also of the sample size) are given in Supplementary Table 1 and 2. “Cy3” stands for the non-sulfonated version of Cy3 whereas “Cy3N” stands for the sulfonated version of Cy3. “n.m.” is not measured.

