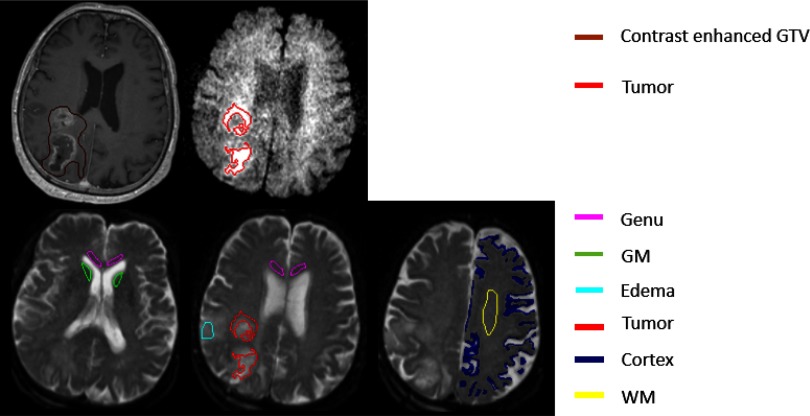
Figure 2.
Illustration of volumes of interest (VOIs) used in the analysis. Brown contours are contrast-enhanced gross tumor volume (GTV) on post-Gd T1-weighted (T1W) images, and red contours are tumor volume (TV) on the diffusion-weighted (DW) images, with b = 3000 s/mm2. Magenta, green, cyan, blue, and yellow contours represent genu, deep gray matter (head of caudate nucleus), edema, cortex, and frontal white matter (WM), respectively.

