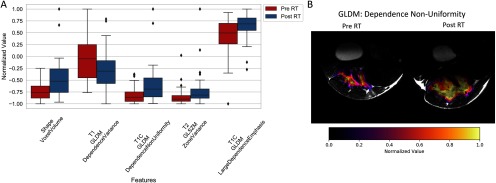
Figure 4.
Change in radiomic features after radiation therapy (RT). Statistically significant differences in radiomics features before and after RT as calculated from the segmented tumors (A). Spatial maps of one of the intensity-based radiomics features, the gray-level dependence non-uniformity (GLDM) (B). Differences in feature intensity are clearly visible between the 2 time points. This image also shows changes in tumor size and shape 1 week after RT.

